
Figures & data
Figure 1. Map of Banks Peninsula with sample locations marked by black triangles.
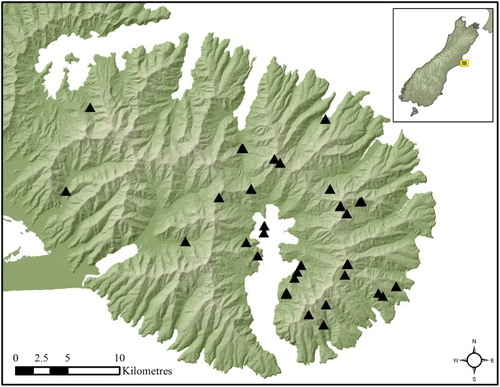
Figure 2. Geophylogeny of Megadromus guerinii CO1 using Bayesian maximum clade credibility tree with taxa nodes mapped to sampling locations on Banks Peninsula. For simplicity, the western and eastern groups are coloured dark red and light blue, respectively.
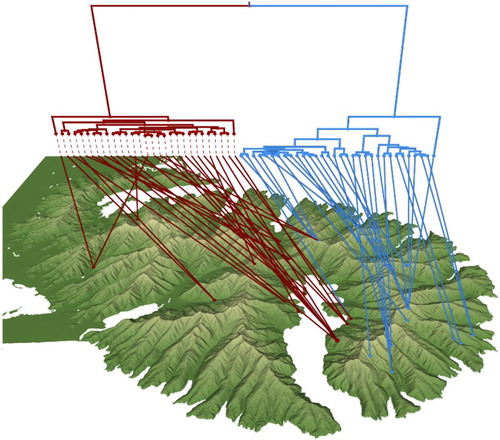
Figure 3. Phylogeographic divergence of Megadromus guerinii CO1 interpreted as the residual phylogenetic divergence per unit distance interpolation from mid-point values across Banks Peninsula via inverse distance weighting with geographic barriers.
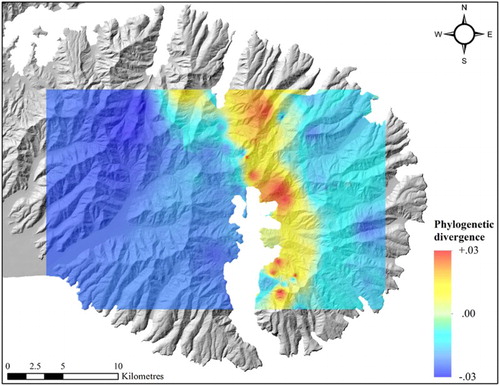
Table 1. Analysis of molecular variance (AMOVA) table generated in Arlequin v3.5 using K2P distances with no added gamma parameters.
Table 2. Diversity measures and Tajima’s D statistics for the entire population and two subpopulations of Megadromus guerinii.
Supplemental material