Figures & data
Figure 1. Photos taken in 1982 at the Ruakura Animal Research Station of the descendants of the sheep captured 6 years earlier from flocks that had been grazing in a feral state for in excess of 40 years. A, Hokonui ewes; B, Campbell Island ewes; C, Raglan ewes. Photos: D. H. B. McQueen.
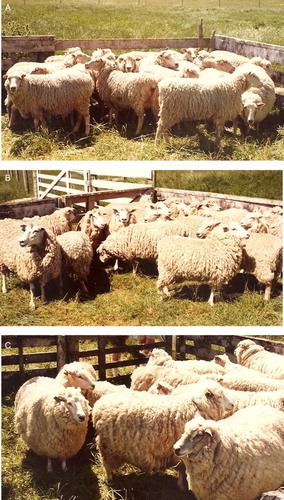
Table 1. Number of records of lambs born, individuals weighed as a yearling the following year and ewes joined each year across the two grazing locations within A, each of the three feral flocks and B, each of the two domesticated flocks that were grazed conjointly with the feral flocks.
Table 2. Proportional distribution (%) of ewe records in each age group at joining across the two grazing locations within A, each of the three feral flocks and B, each of the two domesticated flocks that were grazed conjointly with the feral flocks.
Table 3. A, Mean and standard error of difference (SED) of ewe post-join live weight, ewe fleece weight adjusted to 365 days of growth and ewe live weight per unit fleece weight as a measure of the efficiency of live weight farmed to produce a kilogram of wool for the three feral flocks; B, mean and standard error of the mean (SEM) of the same parameters for two domesticated flocks grazed conjointly with the feral flocks. The SEM for the domesticated flocks has been calculated as the SED reported in the original paper divided by √2, as appropriate for groups of similar size within the accuracy of the quoted SED as only one flock from each study are reported here. Bold text indicates significance at P < 0.05.
Figure 2. Effect of ewe age on mean live weight post-joining in April/May pooled over grazing locations for the three feral flocks, and the two domesticated flocks: Saxon Merino (Sumner & Henderson Citation2013; R. M. W. Sumner, unpubl. data); and Perendale (Sumner et al. Citation2012) grazed conjointly with the feral flocks. Standard error of difference range = 0.6–2.8 kg.
Figure 3. Effect of ewe age on mean greasy fleece weight adjusted to 365 days growth pooled over grazing locations for the three feral flocks, and the recorded fleece weight for the two domesticated flocks: Saxon Merino (Sumner & Henderson Citation2013; R. M. W. Sumner, unpubl. data); and Perendale (Sumner et al. Citation2012) grazed conjointly with the feral flocks. Values for 2-year-old ewes are not comparable between the feral and domesticated flocks. Standard error of difference range = 0.07–0.24 kg.
Table 4. A, Mean and standard error of difference (SED) of reproductive performance for the three feral flocks; B, mean and standard error of the mean (SEM) of the same parameters for two domesticated flocks grazed conjointly with the feral flocks. The SEM for the domesticated flocks has been calculated as the SED reported in the original paper divided by √2, as appropriate for groups of similar size within the accuracy of the quoted SED as only one flock from each study are reported here. Bold text indicates significance at P < 0.05.
Table 5. A, Mean and standard error of difference (SED) of lamb birth weight and lamb weaning weight adjusted for age at weaning, yearling live weight adjusted for age at weighing, yearling wool production adjusted for age at shearing and adjusted yearling live weight per unit of adjusted yearling fleece weight as a measure of the efficiency of live weight farmed to produce a kilogram of wool for the three feral flocks; B, mean and standard error of the mean (SEM) of the same parameters for two domesticated flocks grazed conjointly with the feral flocks. The SEM for the domesticated flocks has been calculated as the SED reported in the original paper divided by √2, as appropriate for groups of similar size within the accuracy of the quoted SED as only one flock from each study are reported here. Bold text indicates significance at P < 0.05. Italic text indicates significance between P = 0.05 and P = 0.10.
Table 6. A, Mean and standard error of difference (SED) of total weight of lambs born per ewe lambing adjusted for sex, total weight of lambs adjusted for sex weaned per ewe weaning lambs and total weight of lambs adjusted for sex weaned per unit of ewe post-join live weight for the three feral flocks; B, mean and standard error of the mean (SEM) of the same parameters for two domesticated flocks grazed conjointly with the feral flocks. The SEM for the domesticated flocks has been calculated as the SED reported in the original paper divided by √2, as appropriate for groups of similar size within the accuracy of the quoted SED as only one flock from each study are reported here. Bold text indicates significance at P < 0.05. Italic text indicates significance between P = 0.05 and P = 0.10.
Figure A1.1. Photo taken in 1976 on Campbell Island of some of the captured Campbell Island rams and ewes before they were transported to mainland New Zealand. The rams were shorn with blades prior to the sea voyage. Photo: W. R. Regnault.