Figures & data
Table 1. GenBank accession number, composition and skew for different Vetigastropoda mitogenomes.
Table 2. Primers used to amplify the complete mitogenome of Haliotis iris.
Figure 1. Circular map of the mitochondrial genome of Haliotis iris. Genes on the outside of the circle were transcribed from the heavy strand in a counterclockwise direction, genes on the inside of the circle were transcribed from the light strand in a clockwise direction. Gene identities: nd1–6 and nd4L, NADH dehydrogenase subunits 1–6 and 4L (in yellow); cox1–3, cytochrome c oxidase subunits I–III (in pink); cytb, cytochrome b (in purple); atp6/8, ATP synthase subunit 6/8 (in light green); 12S/16S ribosomal RNA, small and large subunits of ribosomal RNA (in red). tRNA: Transfer RNA genes (in blue). The line between cox3 and tRNA-Glu indicates control region, the lines between other genes indicate intergenic spacer regions.
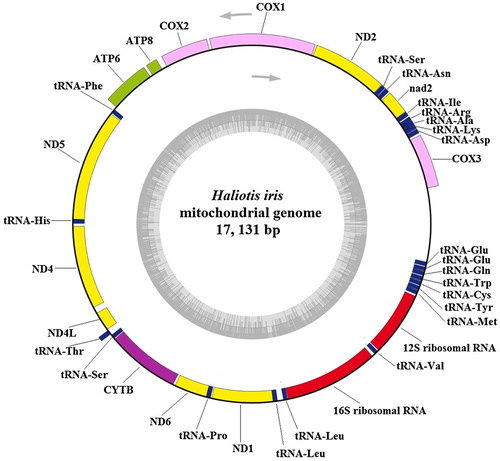
Table 3. Mitochondrial genome order and organisation of Haliotis iris.
Table 4. Codon usages of the protein-coding genes in Haliotis iris mitochondrial genome.
Figure 2. Putative secondary structure of the 22 transfer RNAs (tRNAs) identified in the mitochondrial genome of Haliotis iris. The tRNAs are labelled with the abbreviations of their corresponding amino acids.
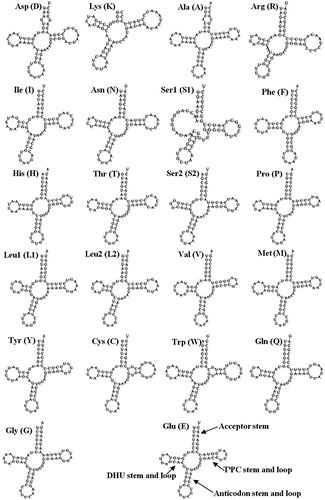
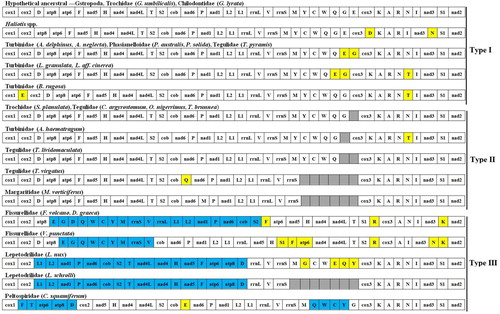
Figure 3. Gene arrangements of 30 Vetigastropoda mitogenomes. Genes without colour correspond to the hypothetical ancestral gastropod arrangement. Genes translocated are coloured in yellow; inversions are in light blue; grey-coloured boxes represent missing genes.