
Figures & data
Figure 1. Map of northern New Zealand displaying locations of sampling sites used in the study. Enlargement indicates locations of sampling sites on Hauturu. For symbol details see and Supplementary Table S1.
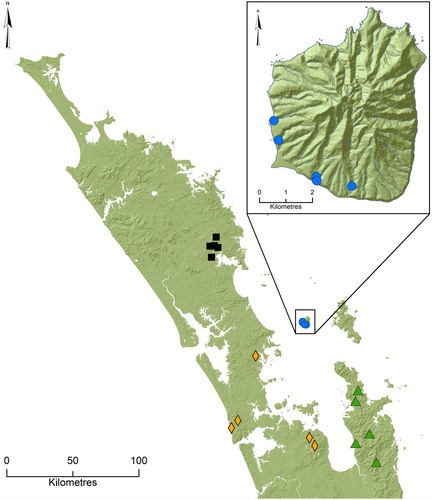
Table 1. Physico-chemical measurements obtained for the five study streams in January 2014. Values given are means of the measurements made (see Methods). Temp. = water temperature, Cond. = conductivity, DO = dissolved oxygen, Width = wetted width of stream channel, Sub. = substrate size, Pfan. = Pfankuch stability index score.
Table 2. Macroinvertebrate fauna recorded from five streams on Hauturu, 15–18 January 2014. L = adult insects collected by light-trapping, S = stream dwelling taxa collected by kick/sweep sampling.
Table 3. Numbers of taxa collected from Hauturu during the 2014 survey from benthic samples, numbers of EPTM (Ephemeroptera, Plecoptera, Trichoptera, Megaloptera) species collected in light traps and total numbers of taxa recorded at each stream.
Figure 2. Cluster analysis of five Hauturu streams based on presence/absence of all benthic and light-trapped invertebrate species collected, using the Bray–Curtis similarity index and UPGMA linkage.
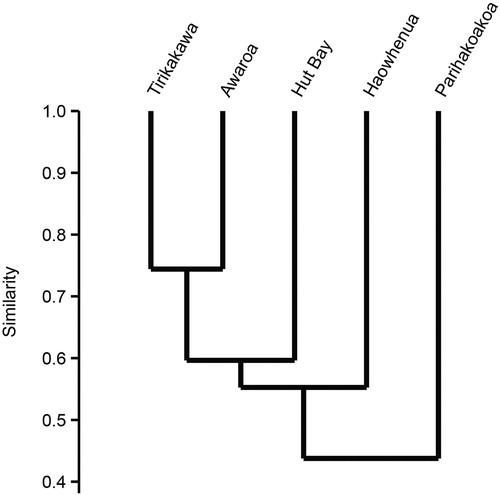
Table 4. Total numbers of taxa, numbers of EPT (Ephemeroptera, Plecoptera, Trichoptera) taxa, Diptera, Mollusca, Crustacea and the top five most abundant taxa, for Hauturu and three adjacent regions of the North Island mainland. All groups are calculated at the MCI level of identification. Data derived from five streams in each region, sampled on two occasions. Top five most abundant taxa are generated from averaged coded abundances.
Figure 3. NMS ordination plot of benthic stream invertebrate communities based on coded abundance data (see Methods) in four regions: Hauturu, Coromandel, Auckland and Whangarei (stress = 0.12). Labels indicate individual sites that correspond to site details in Supplementary Table S1.
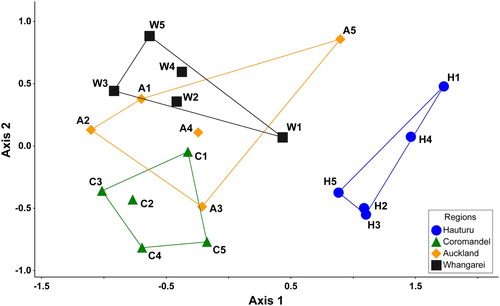
Table 5. Pairwise comparisons of differences in benthic macroinvertebrate community composition between Hauturu, Coromandel, Auckland and Whangarei groups of streams using the multi-response permutation procedure (MRPP). Within-group homogeneity values (A) and their associated P-values are shown.
Table 6. Results of an indicator species analysis (ISA) of benthic macroinvertebrate community composition at Hauturu, Auckland and Whangarei. No indicator taxa were found for Coromandel. Only taxa with significance values <0.05 are shown.
Supplemental material