
Figures & data
Figure 1. Examples of typical bat boxes installed in green spaces of Hamilton City. Top row: Older (10 + years) single chamber (left) and triple chamber (right) Kent style boxes installed by Project Echo. Bottom row: A newer (2 + years) double chamber Kent box (left) and a Schwegler style box (right) installed by Hamilton City Council. Schwegler boxes were not included in the study due to the low number of boxes and difficulties with visually determining occupation by bats.
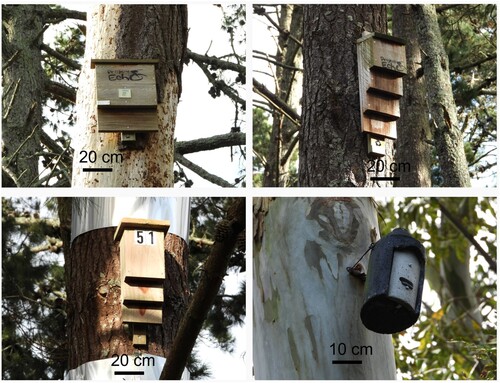
Figure 2. Locations of the monitored bat boxes across eight parks in the southern suburbs of Hamilton City, New Zealand. Note that Donny Park is not presented as this location had a single unoccupied bat box.
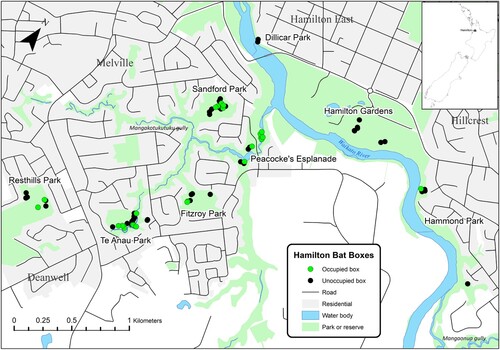
Table 1. A total of 74 bat boxes were monitored across nine green spaces in Hamilton City, the percentages of occupied and unoccupied boxes, and the total number of long-tailed bats observed from May 2021–May 2022.
Table 2. Descriptive statistics of the 15 continuous variables selected for their potential to influence bat box occupation by long-tailed bats in Hamilton City.
Figure 3. Plotted observed versus predicted probability for Hamilton bat box occupation based on multiple logistic regression modelling of 13 variables with box occupation as the dependant variable. The more uniform distribution of points for the observed occupied boxes indicates that the model performed poorly in classifying these boxes.
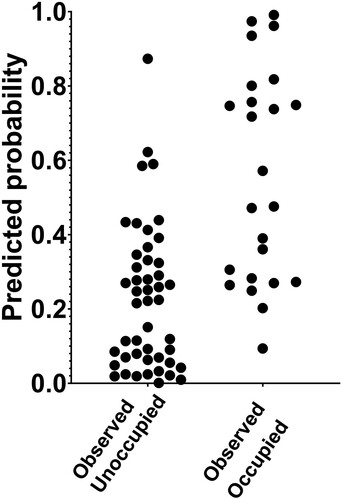
Table 3. Odds ratios from the multiple logistic regression with occupation status as the dependent variable and 13 independent variables selected as potential predictors of bat box occupation.