
Figures & data
Figure 1. Total spider, total adult spider, and total immature spider counts (per sample per site), and adults as a percentage of total spiders from sampling at three different New Zealand locations. Error bars are 95% confidence limits. Sampling methods are described in the text.
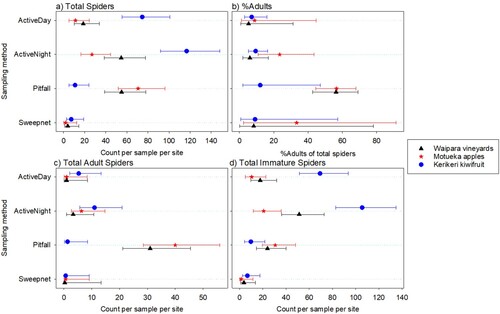
Figure 2. Total numbers of spiders caught per sample for each main family observed at three different New Zealand locations. Error bars are 95% confidence limits. Where the mean is 0, the upper limit is difficult to obtain, so is not shown. Sampling methods are described in the text.
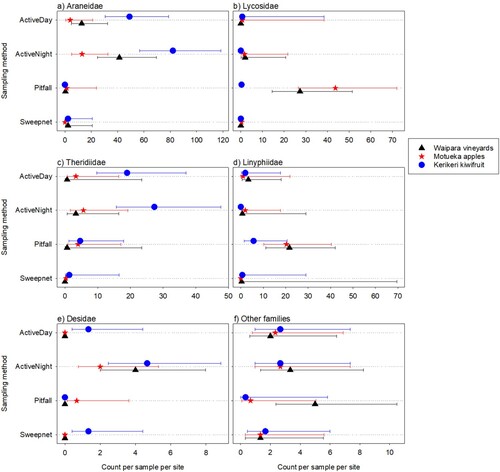
Table 1. Numbers of adult spiders of each sex found for each species from three different New Zealand locations. Families are in decreasing order of prevalence. E = New Zealand Endemic, N = New Zealand Native, I = Introduced, U = Unknown status. M = male, F = female.
Figure 3. Total numbers of Opiliones caught per sample at three different New Zealand locations. Error bars are 95% confidence limits. Where the mean is 0, the upper limit is difficult to obtain, so is not shown. Sampling methods are described in the text.
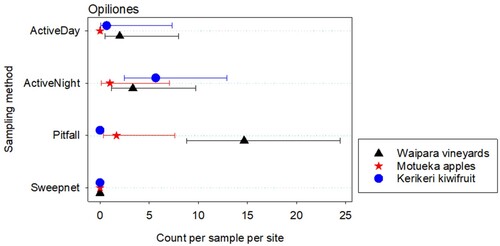
Table 2. Percentages of spiders found for different sampling methods in each family from three different New Zealand locations. Sampling methods are described in the text.
Table 3. Average numbers of spiders per New Zealand site caught for each main family (95% Confidence limits). * where the mean is 0, the upper limit is difficult to obtain, so is not shown. Sampling methods are described in the text.
Figure 4. Total numbers of adult spiders caught per sample per site for each main family observed at three different New Zealand locations. Error bars are 95% confidence limits. Where the mean is 0, the upper limit is difficult to obtain, so is not shown. Sampling methods are described in the text.
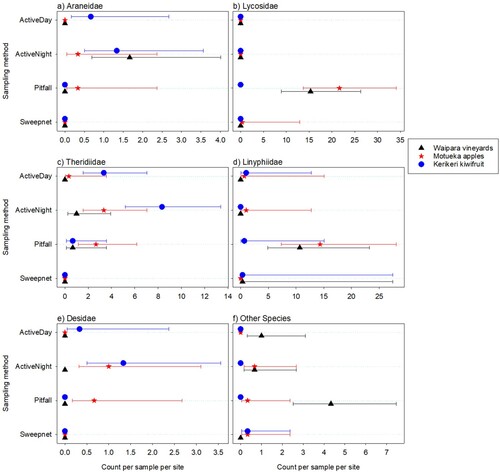
Figure 5. Total numbers of immature spiders caught per sample per site for each main family observed at three different New Zealand locations. Error bars are 95% confidence limits. Where the mean is 0, the upper limit is difficult to obtain, so is not shown.
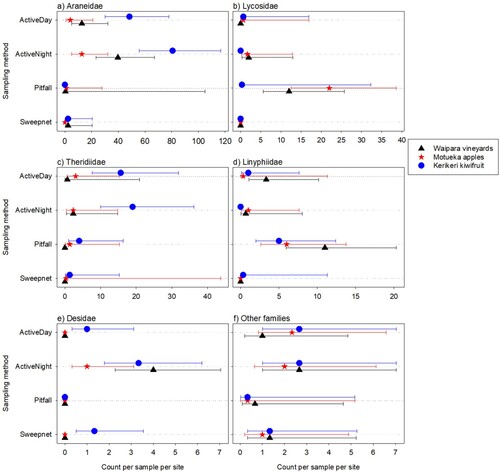
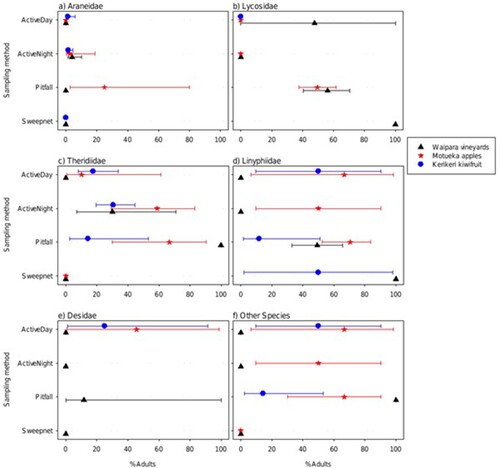
Figure 6. The percentages of spiders caught that were adults out of the total, for each of the families when sampled at three different New Zealand locations. Error bars are 95% confidence limits. Where the mean is 0 (or 100), the upper (or lower) limit is difficult to obtain, so is not shown. Sampling methods are described in the text.