
Figures & data
Figure 1. Map of New Zealand showing the locations where acoustic data was collected. Inset: Doubtful Sound, bottom, and Great Barrier Island, top.
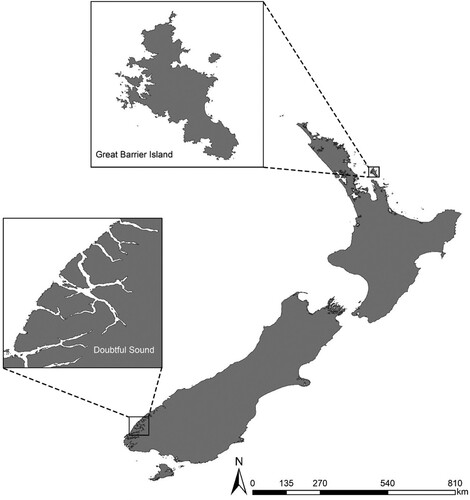
Figure 2. Examples of non-signature whistles found in the studied populations. Y-axis units kHz; X-axis units s.
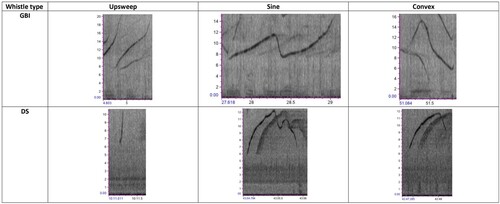
Figure 3. Graphical representation (box and whisker plot) of the variation of whistle parameters measured at two locations in New Zealand. DS: Doubtful Sound and GBI: Great Barrier Island. MinF: Minimum frequency; MaxF: Maximum frequency; FR: Frequency range; SF: Start frequency; and EF: End frequency. The box represents the middle 50% of each data set, the lines are median values, and the whiskers indicate the range of the data. Outliers are indicated by dots.
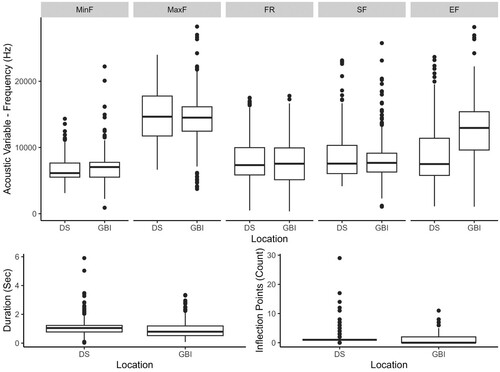
Figure 4. Relative frequency of whistle type at Doubtful Sounds = DS (n = 509) and Great Barrier Island = GBI (n = 577).
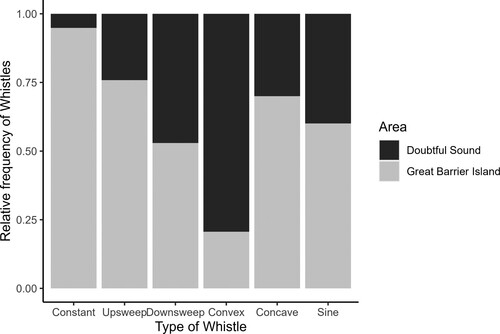
Figure 5. Random Forest variable importance plot. On the left, mean decrease accuracy where the points represent the loss of accuracy in the model if a variable is removed. On the right, mean decrease Gini value indicates the importance of each variable in the model.
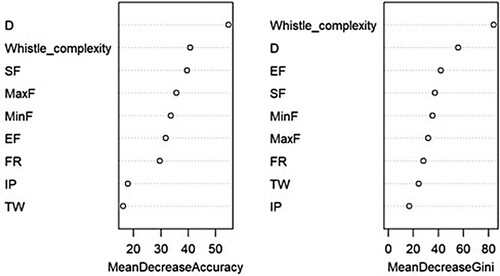
Figure 6. Distribution of the mean whistle parameters along Principal Component 1 and Principal Component 2. Doubtful Sound = DS, Great Barrier Island = GBI. Refer to and the Acoustic analysis section of the Methods for details of the seven acoustic parameters used in the PCA
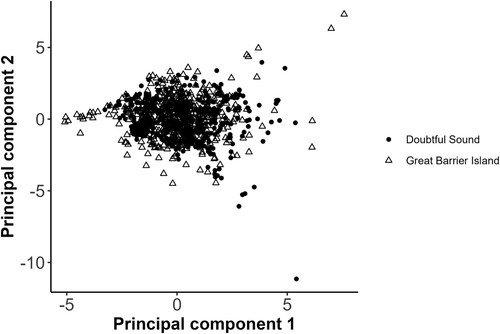
Table 1. Loading scores, total variance explained and eigen values from a NIPALS PCA of acoustics parameters in whistles of bottlenose dolphins from GBI and DS.
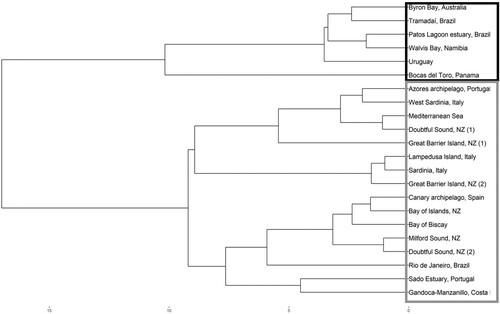
Figure 7. Hierarchical cluster visualisation of population similarity based on the mean values of six time-frequency parameters for 21 populations of bottlenose. Coloured rectangles show two main clusters. The Byron Bay population corresponds to Tursiops aduncus and it was used as external group for the analyses.
Note: (1) This study (2) Previous studies carried out in the study areas.
Supplemental material
Download MS Word (32.4 KB)Data availability statement
The datasets analysed during the current study are available from the corresponding author.