Figures & data
Table 1. Chemical analysis of the iron ore pellets (wt-%).
Table 2. Thermal and gas profile followed during the experiments [Citation8].
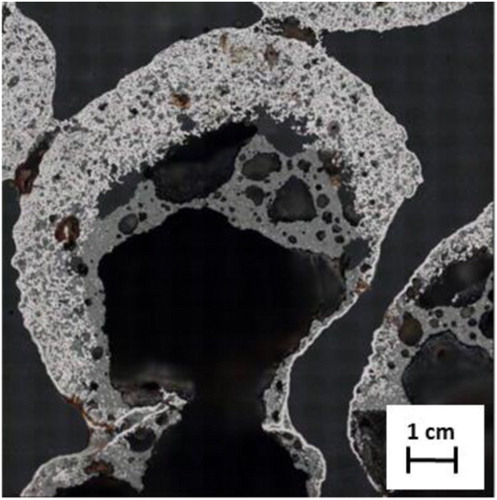
Figure 1. Photographs of the sample bed quenched from high temperatures [Citation8]. Encircled pellets are selected for detail analysis.
![Figure 1. Photographs of the sample bed quenched from high temperatures [Citation8]. Encircled pellets are selected for detail analysis.](/cms/asset/628f9d6c-89e0-4d8e-9fcf-a3818a4fcb3f/yirs_a_1510873_f0001_oc.jpg)
Figure 2. Phase identification and quantification from the micrograph using image processing application (GIMP).
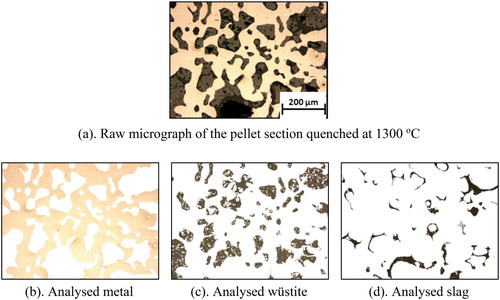
Figure 3. XRD patterns of the quenched pellets.
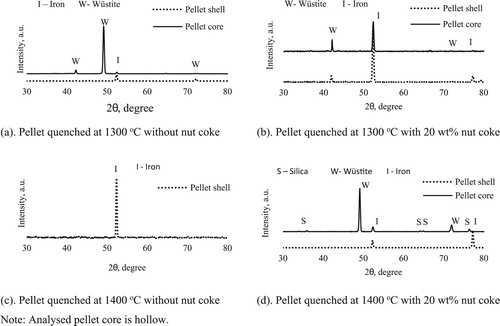
Figure 4. SEM–EDS micrographs of the quenched pellet sections.
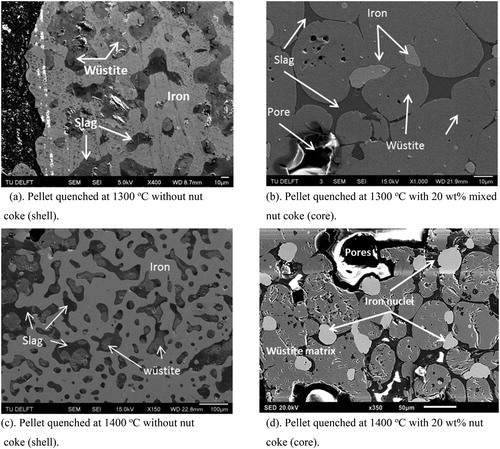
Figure 5. Sample quenched from 1300oC.
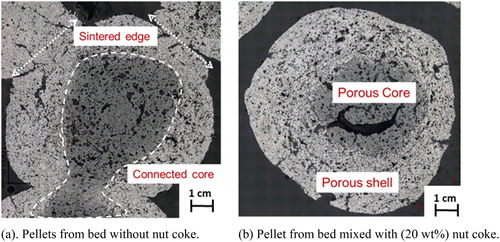
Figure 6. Phases and pores distribution in the pellet quenched at 1300oC.
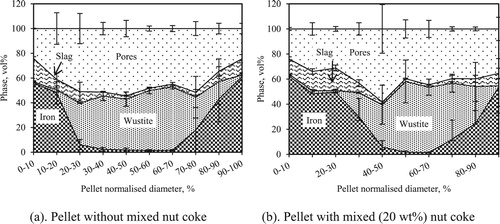
Figure 7. Phases and pores distribution in pellets quenched from 1400oC without nut coke.
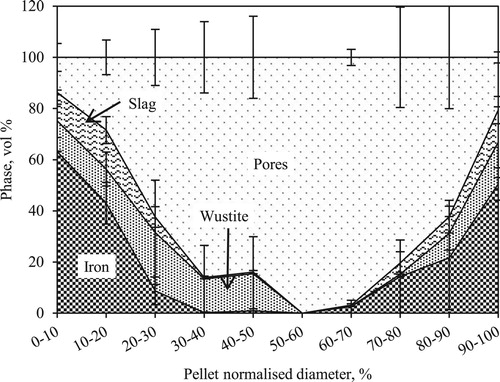
Figure 8. Phases and pores distribution in pellets quenched from 1400oC with nut coke (20 wt-%).
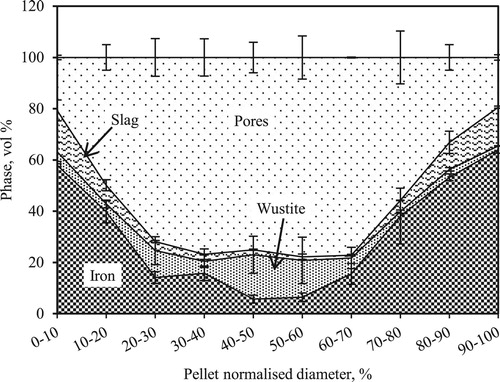
Figure 9. Reflected light microscopy of the pellet quenched from 1400oC with 20 wt-% mixed nut coke.
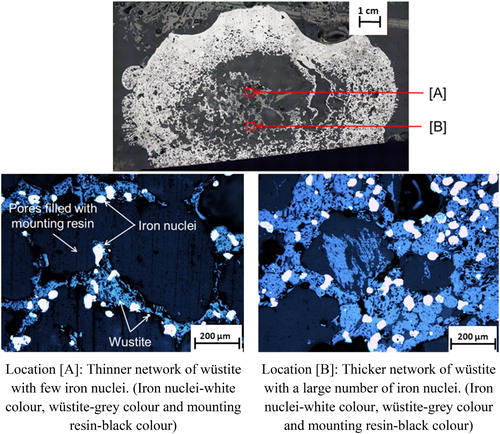
Figure 10. Hollow icicles formation in the cohesive zone, adapted from Gudenau et al. [Citation13].
![Figure 10. Hollow icicles formation in the cohesive zone, adapted from Gudenau et al. [Citation13].](/cms/asset/73898d96-c669-4dc4-be23-77f53b9b40d2/yirs_a_1510873_f0010_oc.jpg)
Figure 11. Micrograph of the pellet quenched from 1400oC without nut coke.