Figures & data
Table 1. Chemical analysis of the ferrous raw materials (XRF).
Table 2. Thermal and gas profile followed during the experiments.
Figure 1. Characteristic behaviour of the iron ore pellet (type 1) bed under blast furnace conditions.
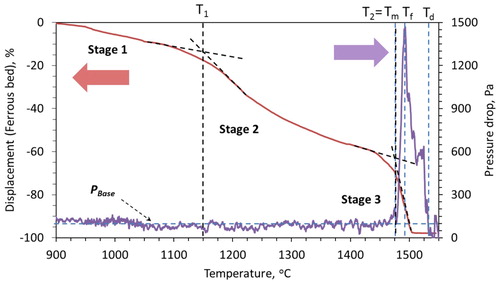
Figure 2. Characteristic behaviour of iron ore sinter bed under blast furnace conditions.
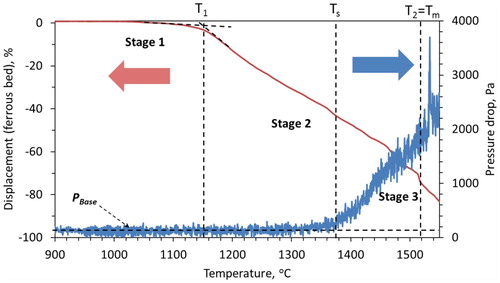
Figure 3. SiO2–CaO–FeO-(5%) MgO phase diagram with slag liquidus temperature projections (Factsage).
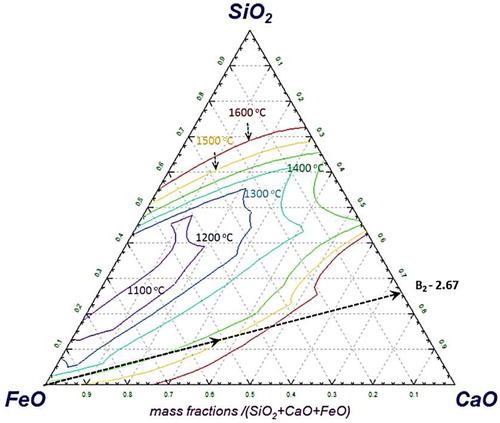
Figure 4. Photographs of two halves of quenched iron ore sinter bed at 1550°C.
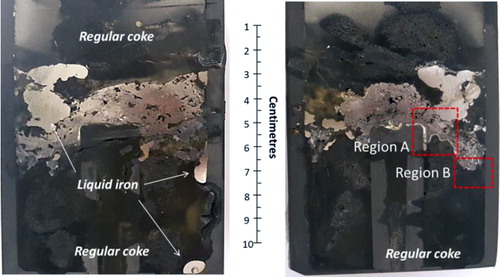
Figure 5. Microstructure of the selected regions from quenched iron ore sinter bed.
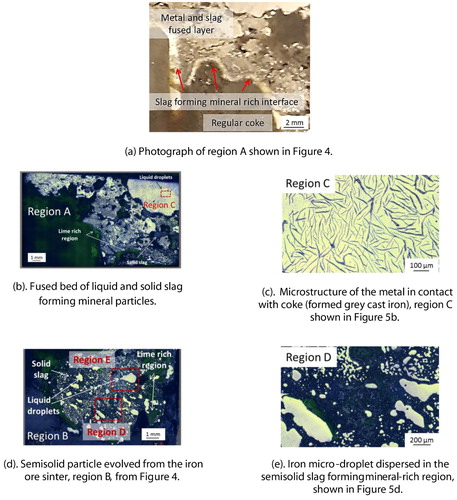
Figure 6. EDS scan of a selected region E from quenched iron ore sinter bed (). An entrapped liquid iron droplet present inside the bed.
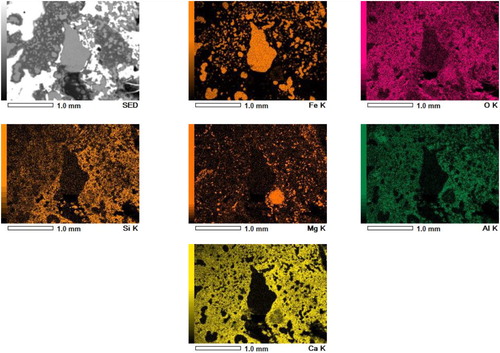
Figure 7. Phase diagram (SiO2–CaO–MgO–(6.25%) Al2O3) with liquidus temperature projections.
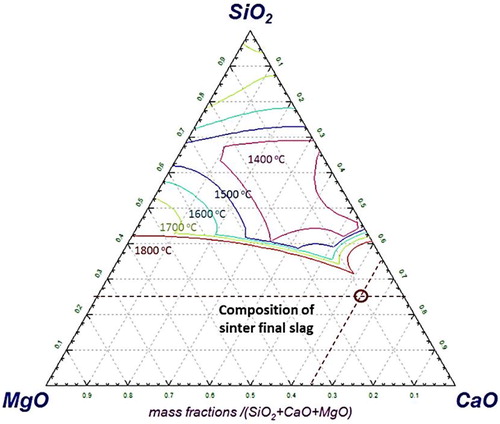
Figure 8. Bed contraction profile for ferrous raw materials.
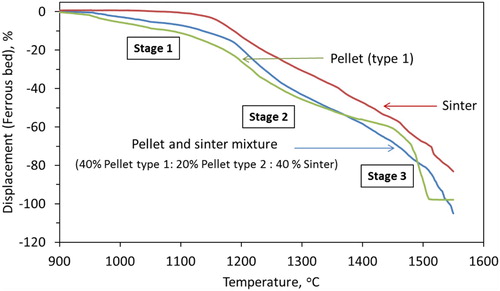
Figure 9. Measured profile of pressure drop for ferrous raw materials bed under simulated blast furnace conditions.
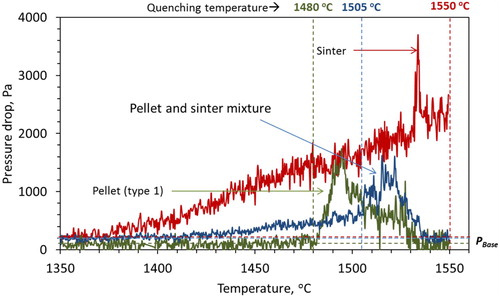
Figure 10. Measured S-value for different burden type (S-value; a measure of resistance to the gas flow during softening and melting of the ferrous burden).
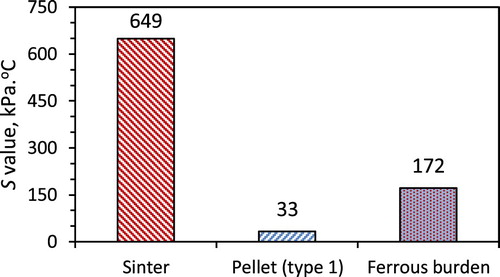
Figure 11. Two halves of the ferrous burden (pellet and sinter mixture) quenched at 1505°C (P-Pellet, S-Sinter, RC- Regular coke).
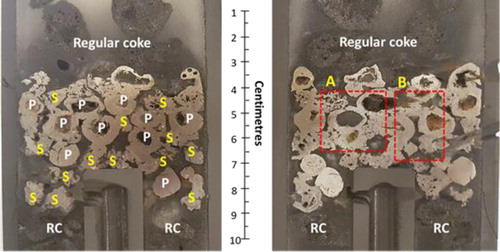
Figure 12. Selected section (region A) from the ferrous bed quenched at 1505°C ().
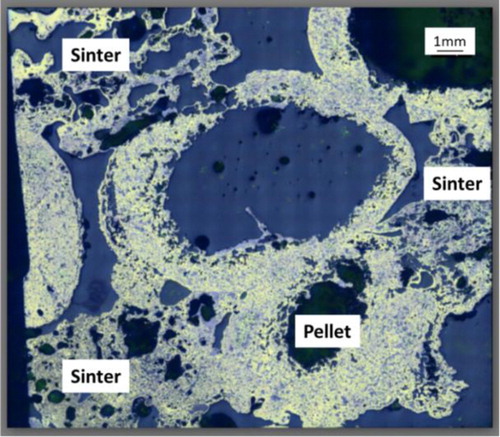
Figure 13. SEM-EDS micrograph of an interface between pellet and sinter.
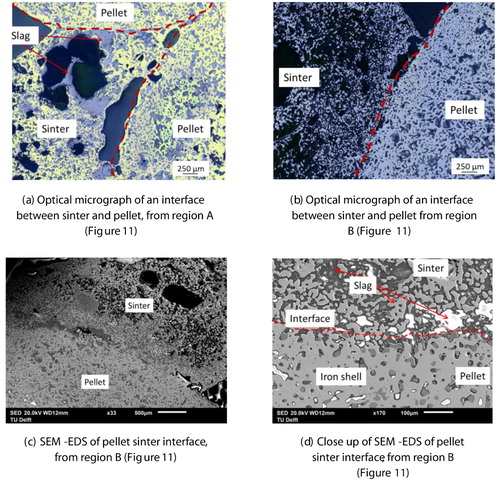
Figure 14. SEM-EDS elemental scan at the of the pellet-sinter interface ((d)).
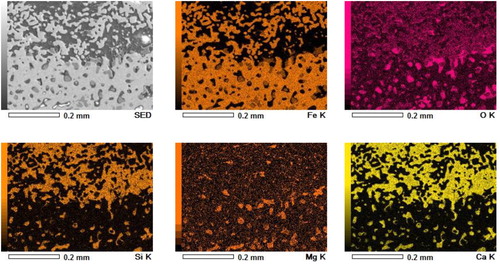
Figure 15. Temperature when the first liquid drop was observed.
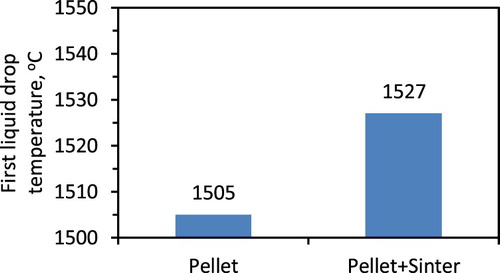
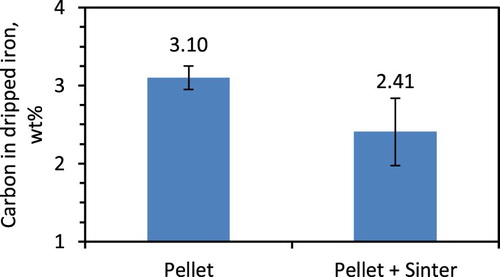
Figure 16. Effect of burden type on the iron carburisation.