3,450
Views
18
CrossRef citations to date
0
Altmetric
Research articles

The framing of climate change in New Zealand newspapers from June 2009 to June 2010

, &
Pages 1-20 | Received 09 Jun 2014, Accepted 20 Nov 2014, Published online: 20 Feb 2015

Figures & data

Table 1 Frame typology.

Table 2 Source categories.
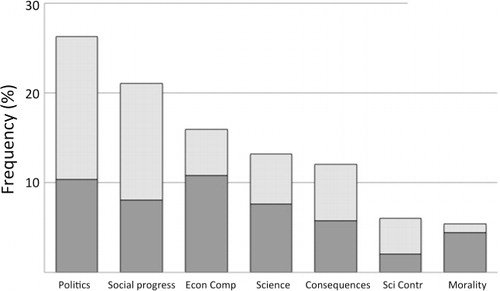
Figure 1 Total number of climate change articles in The New Zealand Herald, The Press and The Dominion Post between June 2009 and June 2010 (n = 540). Coverage grew over the first half of the study period, reaching a peak during November (99 articles) and December 2009 (122 articles), coinciding with the breaking of the Climategate email hacking and the highly anticipated Copenhagen Summit.
Figure 2 Frame prominence across The New Zealand Herald, The Press and The Dominion Post between June 2009 and June 2010, showing the frequency that each frame was Present (dark grey, below) or Dominant (light grey, above) in articles. Econ Comp, Economic Competitiveness; Sci Contr, Scientific Controversy.
Figure 3 Mean frame score (0–2) of each frame, comparing The New Zealand Herald (n = 243, pale grey), The Dominion Post (n = 153, dark grey) and The Press (n = 144, white). Significant differences were detected in the mean scores of the Economic Competitiveness (Economic Comp.) (F [2,537] = 8.606, P < 0.05), Science (F [2,537] = 4.633, P < 0.05) and Consequences (F [2, 537] = 4.880, P < 0.05) frames.
Figure 4 Frequency of employment of the Politics frame over the study period. A steep drop in frame frequency occurred in January 2010 following the failure of the Copenhagen Summit, before it began to rise again in May 2010, from renewed debate around the Emissions Trading Scheme.

Reprints and Corporate Permissions

Please note: Selecting permissions does not provide access to the full text of the article, please see our help page How do I view content?

To request a reprint or corporate permissions for this article, please click on the relevant link below:

Academic Permissions

Please note: Selecting permissions does not provide access to the full text of the article, please see our help page How do I view content?

Obtain permissions instantly via Rightslink by clicking on the button below:

If you are unable to obtain permissions via Rightslink, please complete and submit this Permissions form. For more information, please visit our Permissions help page.