Figures & data
Figure 1. Simplified diagram showing animal urine-N as the main source for N2O emissions and leaching losses in a grazed grassland, and the point of intervention by a nitrification inhibitor (from Di & Cameron Citation2016).
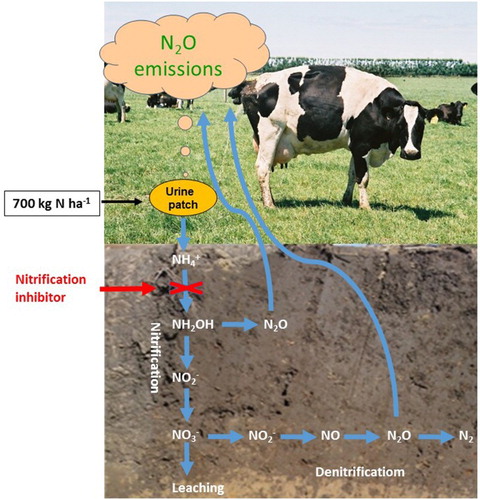
Figure 2. AOB amoA gene abundance as affected by the application of dairy cattle urine (1000 kg N ha−1) and the nitrification inhibitor DCD in a dairy pasture soil (from Di et al. Citation2009a).
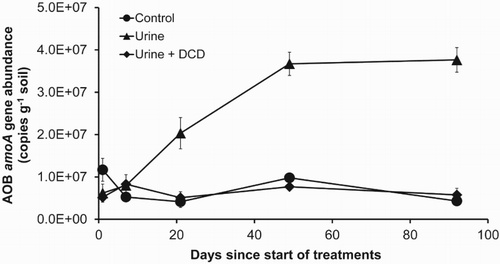
Figure 3. AOA amoA gene abundance as affected by the application of animal urine (1000 kg N ha−1) and the nitrification inhibitor DCD (Di et al. Citation2010b).
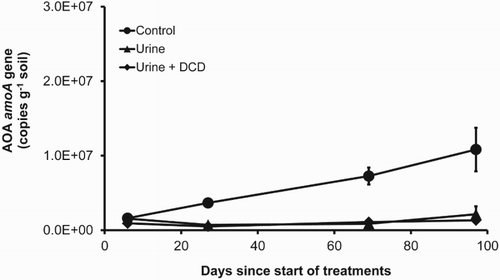
Figure 4. Example breakthrough curve showing the effect of DCD applied at 10 kg DCD ha−1 on concentration from animal urine applied at 1000 kg N ha−1 (from Di et al. Citation2009b).
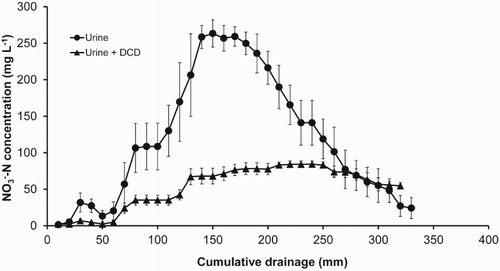
Figure 5. Daily N2O emissions from a Lismore soil from dairy cattle urine with and without DCD (10 kg DCD ha−1) showing the effect of DCD on N2O emissions (after Di & Cameron Citation2006).
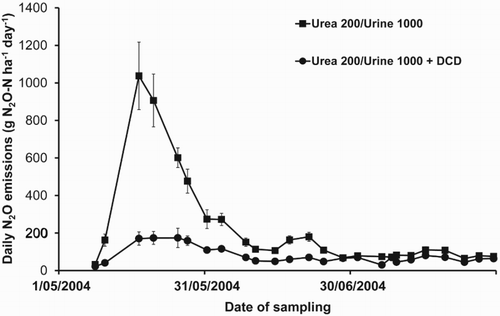
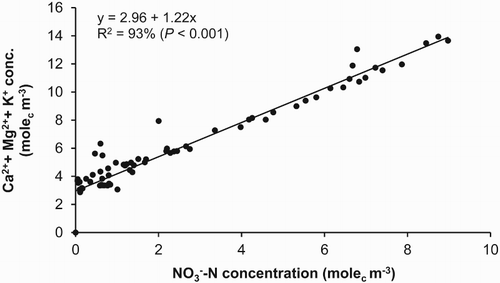
Figure 6. Relationship between the concentrations of and cations (Ca2+, Mg2+ and K+) in the leachate from the lysimeters (from Di & Cameron Citation2005).