Figures & data
Table 1. Summary of the types, sources, temporal and spatial scales of biophysical data used in the study.
Table 2. Mean percentage change (and standard deviation) in catchment stock numbers and area for different stock classes for the periods 1999–2013 and 2006–2013 and their respective comparison (Pearson correlation coefficient) to trends between 1994–2013 and 2004–2013 for either in the percentage change in median annual FRP or TP concentrations and clarity.
Figure 1. Co-location of trends for decreasing FRP or TP and increasing clarity for 1994–2013 and 2004–2013 and land use in each catchment for 2013. Blank areas within a catchment are most likely to be native forest or mountains.
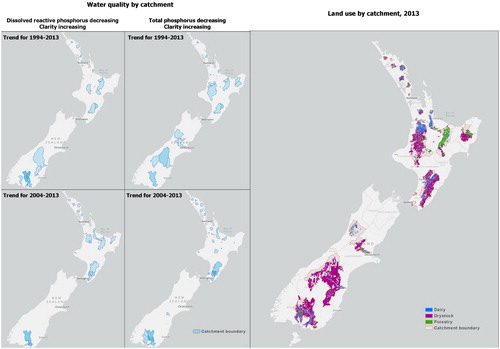
Table 3. Count of sites for the 1994–2013 and 2004–2013 periods showing an increasing or decreasing trend in FRP or TP concentrations, and the count of sites for the same periods exhibiting a decreasing trend in FRP or TP concentrations and increasing clarity at the same site. Sites showing indeterminate trends were not considered.
Figure 2. Annual quantity (Mg) of imported P given as sales of superphosphate and RPR and imported feed (PKE = Palm Kernel Extract) using their average per cent P concentrations (DairyNZ Citation2018).
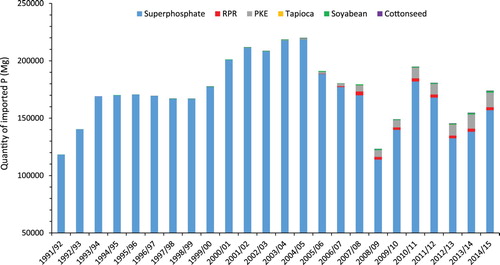
Figure 3. The relative percentage of samples in excess of the agronomic optimum in Olsen P concentration for pasture production (20, 35, 45 and 45 mg P L−1 for Sedimentary, Volcanic, Pumice and Peat soils, respectively) submitted to Eurofins and Hills laboratories (n ∼ 500,000) between 1988–1996, 1997–2001 and 2002–2014. Data for 1988–1996 and 1997–2001 is from Wheeler et al. (Citation2004).
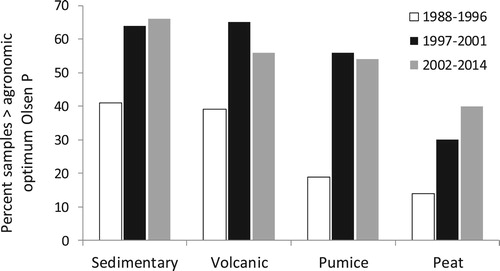
Table 4. Trends in topsoil Olsen P concentrations (mg L−1) between 2002 and 2014 and submitted to ARL, Eurofins and Hill Laboratories.
Figure 4. Mean annual load of FRP lost in leachate from the top 30-cm of three pasture soils of varying ASC (51–72%) receiving either no N or 150 or 300 kg N ha−1 yr−1 as urea (Dodd et al. Citation2014).
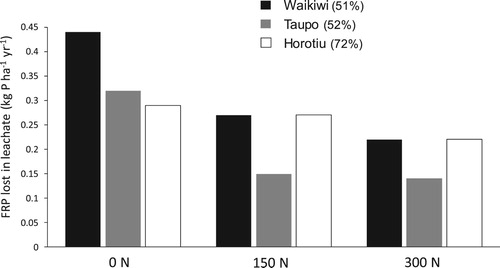
Table 5. Data for the regional tonnage of N fertiliser applied in New Zealand in 2002 and the percentage change in tonnes applied by 2012.
Table 6. The relative percentage of sites exhibiting increasing trends in nitrate (NO3), decreasing trends in FRP and their co-location in streams and rivers or groundwater for data for 2004–2013.
Table 7. Range of strategies used in management, as an amendment or at the edge of the field to decrease P losses to water, their effectiveness, cost and citation noting the year that their cost-effectiveness was assessed.
Table 8. The percentage by region of dairy farms in full compliance (after comma = significant non-compliance) with effluent regulations at the beginning (2003/2004), middle (2007/2008) and end (2011/2012) of the Clean Streams Accord.
Figure 5. The employment characteristics of the 2093 rural professionals who will have completed a Sustainable Nutrient Management course in New Zealand Agriculture.
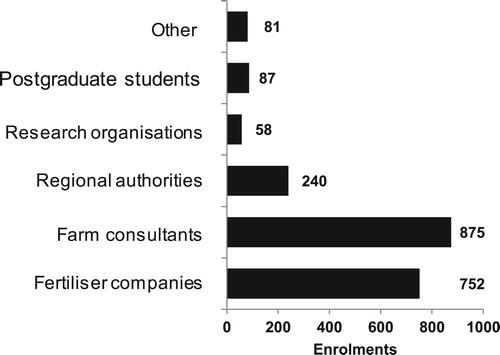
Figure 6. The employment characteristics of the 856 rural professionals who will have completed an Advanced Sustainable Nutrient Management course.
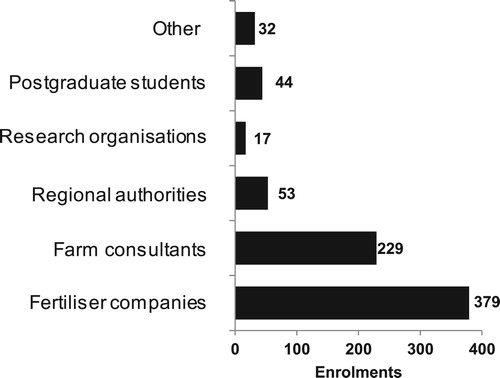
Figure 7. The origin of the 856 rural professionals who will have completed an Advanced Sustainable Nutrient Management course.
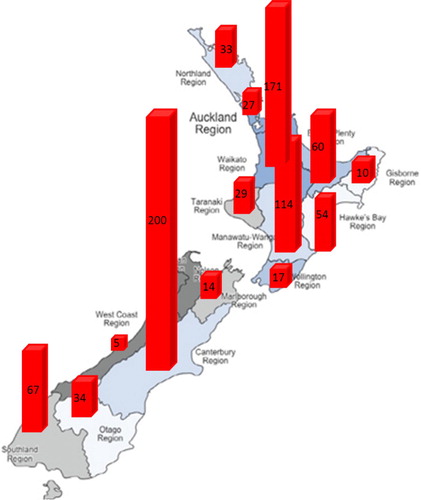
Figure 8. Number of web citations per year and the cumulative number of articles (popular and from scientific journals) on critical source areas (CSAs) and land–water–P interactions over time. Of the 159 scientific documents produced (as of April 2018), 47 were academic papers, 75 were from policy (central or regional), 30 were from industry, while 14 were from non-governmental organisations (Source = Google analytics).
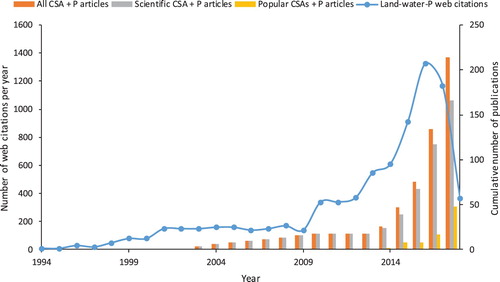
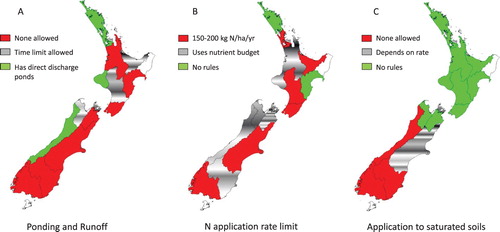
Figure 9. The management of farm dairy effluent by Regional Authorities in New Zealand to decrease N and, by inference, P losses. Management focuses on restricting effluent application to soils to prevent ponding and runoff year-round (A: none, refers to no ponding or runoff allowed at any time; time limit, allows for some ponding and runoff; and direct discharge refers to discharges from effluent settling ponds directly to streams), limiting applications over the year to not exceed a N rate for the effluent block (B: <150–200 kg N ha−1 yr−1 via direct measurement of the effluent or a nutrient budget), and restricting applications to saturated soils in winter (C: applications are either not allowed, allowed if below a certain rate, or unrestricted). Figure modified from McDowell et al. (Citation2017).