Figures & data
Figure 1. Age-standardised ratio (ASR) for lip, oral cavity, pharyngeal and salivary gland cancer for New Zealand 1960–2015. The figure showed ASR peak between 1975 and 1995, with the highest ASR recorded in 1989 (Ministry of Health Citation2016).
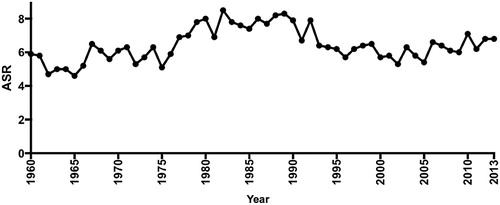
Figure 2. Showing immunhistochemistry (IHC) staining with 3,3′-Diaminobenzidine (DAB) chromogen of selected antibodies (brown staining). (A) OSCC group: CD8+ cells were sparsely distributed in the deeper connective tissue (x200, bar: 50 m). (B) OSCC group: Moderate numbers of CD8+ cells around strands and islands of malignant keratinocytes (x200, bar: 50 m). (C) Control group: The frequency and intensity of staining was more than in OSCC sections with focal collections of CD8+ cells in the control tissues in comparison to the sparse distribution in OSCC sections (x200, bar: 50 m).
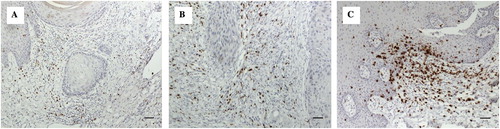
Figure 3. Box and whisker plot showing significantly more T regs in the TME of OSCC than inflamed control tissue. IHC staining was used to stained T regs positive cells using FoxP3 antibody and DAB chromogen.
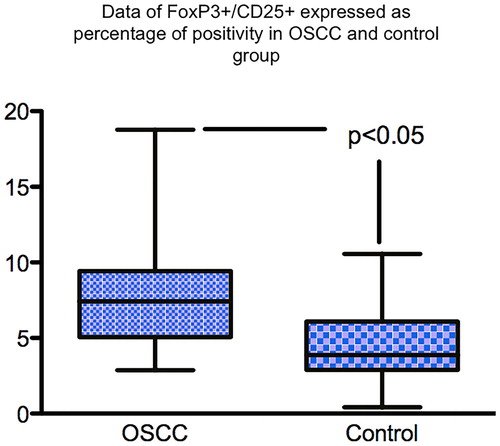
Figure 4. Photomicrographs showing the expression of TLR2 in the stroma of inflammatory hyperplasia. A, and OSCC B. Expression of TLR2 was significantly more in OSCC tissues in comparison to control group (inflamed mucosa). IHC staining was used to stained TLR2 positive cells using TLR2 antibody and DAB chromogen.
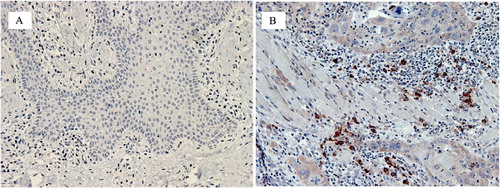
Figure 5. Photomicrograph showing co-expression of FoxP3 (red nuclear fluoresence) and TLR2 (green ring fluoresence) in the stromal cell in OSCC (cell on the lower right). Double immunofluoresence technique was used for staining of FoxP3 and TLR2 positive cells using Alexa red and green chromogen.
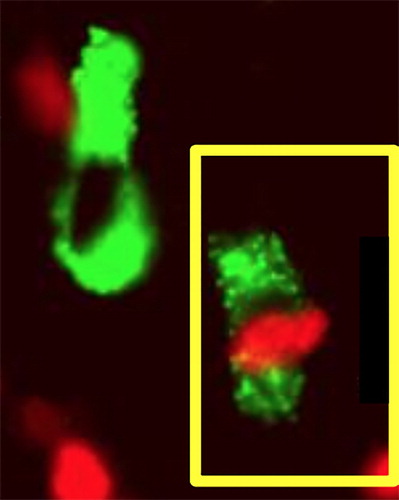
Table 1. MMP genes which coded for enzymes that degrade ECM proteins were significantly upregulated in OSCC cell lines treated with IL-17.
Figure 6. Box and whisker plot showing a significantly greater lymphatic vessel density (using D2-40/podoplanin) in the TME of OSCC than ininflamed and uninflamed control tissue. IHC staining was used to stained D2-40 positive cells using D2-40/podoplanin antibody and DABchromogen (*indicates p<0.05, o indicates an outlier value).
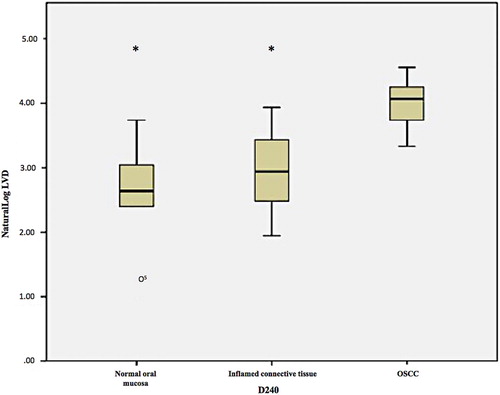
Figure 7. A&B: A, Graph showing SCC4 cell line subjected to tunicamycin-induced ER stress (test and control). B, Photomicrograph SCC cell line subjected to tunicamycin-induced ER stress with TUNEL staining. Blue = DAPI, Green = TUNEL. SCC4 cell line maintained cell viability in the presence of ER stress at a significantly greater level.
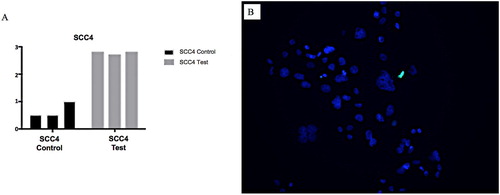
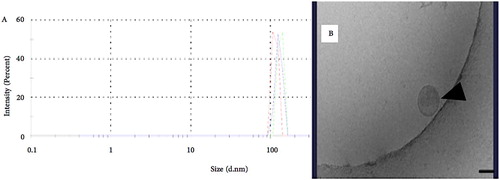
Figure 8. A&B: A, Graph from Dynamic Light Scattering showing peaks from 3 different runs of exosomes derived from SCC4 cell line. The figure showed light peaks are at 110 nm. B, TEM image of exosome from SCC4 cell line.