Figures & data
Figure 1. J.J. Thomson with his graduate students in 1897. Front row from left: E.B.H. Wade, G.B. Bryan, W. Craig-Henderson, J.J. Thomson, J.S. Townsend, E. Rutherford. Back row from left: S.W. Richardson, C.T.R. Wilson, J. Henry, J. McClelland, L. Blaikie.
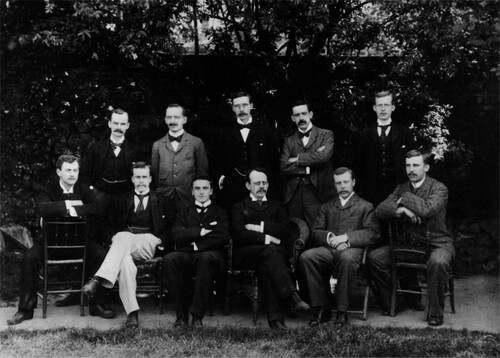
Figure 2. Rutherford's magnetic radio wave detector
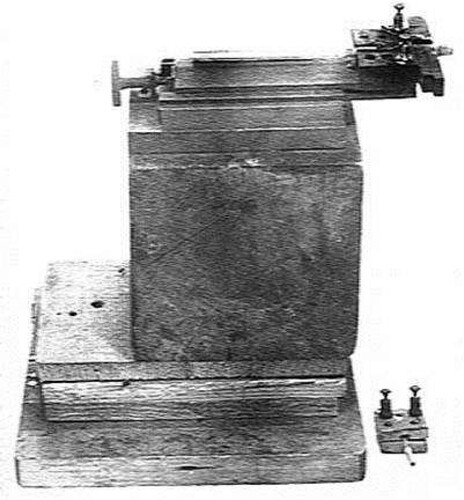
Figure 3. The apparatus with which Rutherford and Chadwick refined measurements of the nuclear disintegration of different atomic nuclei (Rutherford and Chadwick Citation1921).
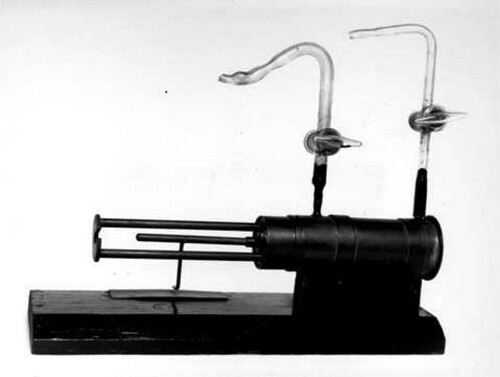
Figure 4. (left) The ejection of protons from nitrogen nuclei by α-particles. In the top stereographic pair, the proton is ejected in the forward direction. In the lower image it travels in the backward direction (Blackett Citation1925). (right) A schematic diagram showing the tracks of the incoming α-particles and the paths of the nuclei in heavy black lines and the paths of the protons in thin lines in Figures – in the left-hand panel.
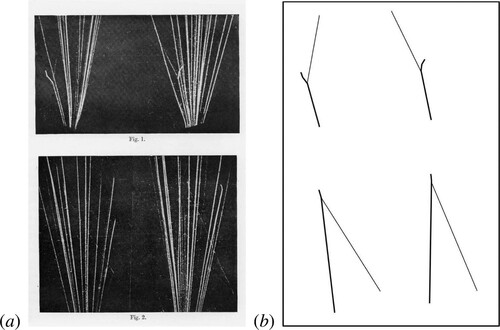
Figure 5. A ‘next vintage’ version of the Wynn-Williams' scale of two counters. In the 1980s, he tried to find the original, but it was long gone. This second generation counter survived (Wynn-Williams Citation1984).
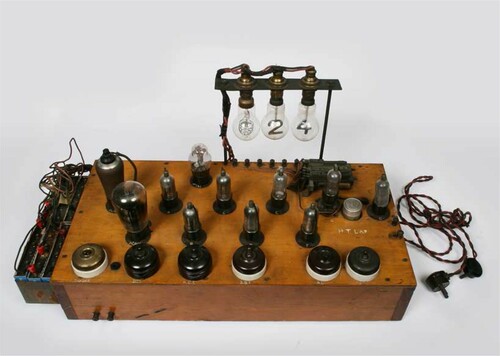
Figure 6. This famous photograph of Rutherford and Ratcliffe of 1932 was taken by Wynn-Williams who switched on the illuminated sign ‘Talk Softly Please’ just before Rutherford's arrival. The trolley contains the rebuilt Wynn-Williams and Ward amplifier as well as the three power supply batteries, enabling them to be moved from one laboratory to another (Lewis Citation1984).
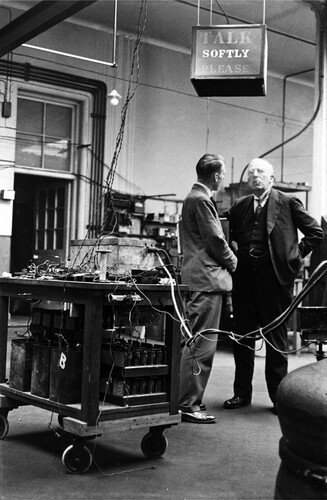
Figure 7. A, The ‘source vessel’ with which Chadwick discovered the neutron (Chadwick Citation1932). B, The layout of Chadwick's neutron experiment. The source vessel is on the left and the ionisation chamber on the right (Hendry Citation1984).
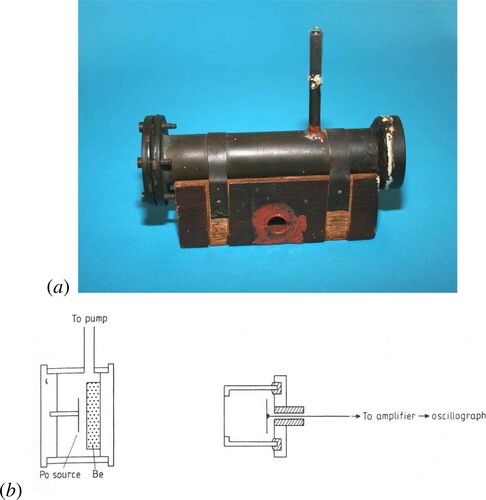
Figure 8. The apparatus with which Cockcroft and Walton artificially disintegrated lithium nuclei (Cockcroft and Walton Citation1932). Walton is sitting inside the little tent, observing the decay products on a luminescent screen. Cockcroft is on the left.
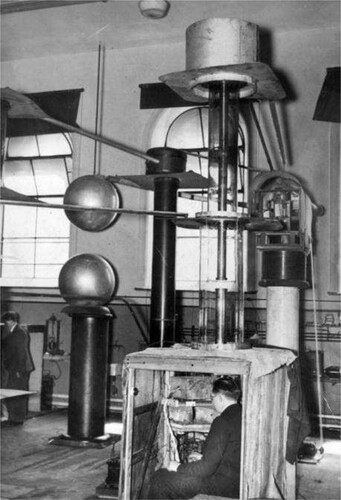
Figure 9. A example of the energy spectrum of electrons emitted in the β-decay process. This spectrum shows the continuous electron energy spectrum found in the radioactive decay of radium-E (Bi) (Neary Citation1940).
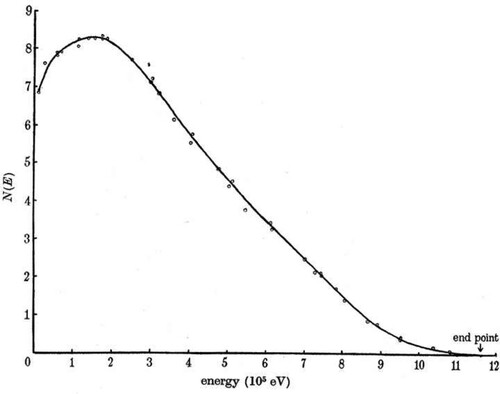
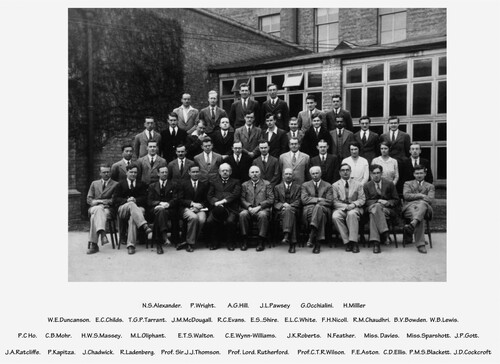
Figure 10. Staff and research students in the Cavendish Laboratory in 1932.