Figures & data
Figure 1. A, Rutherford cross section in the centre-of-mass frame valid for scattering of distinguishable particles interacting via a Coulomb potential. Dashed lines show the angular yield for each type of particle, while the solid line is the total yield. B, Measured angular distribution of α-α scattering, i.e. scattering between identical bosons. The data points do not follow the Rutherford cross section but agree perfectly with Mott's formula. Reprinted figure with permission from N. P. Heydenburg and G. M. Temmer, Phys. Rev. 104, 123 (1956). Copyright 1956 by the American Physical Society.
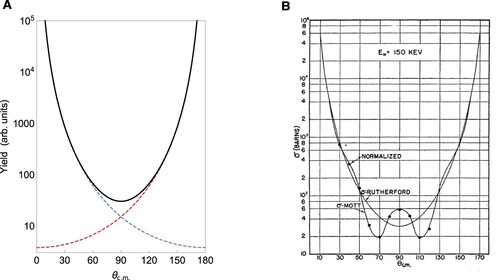
Figure 2. Collisions between distinguishable particle. See main text for description.
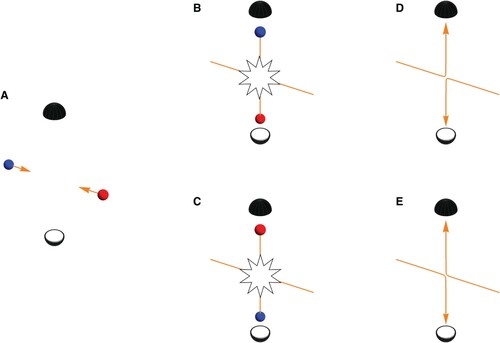
Figure 3. Collisions between indistinguishable particles. See main text for description.
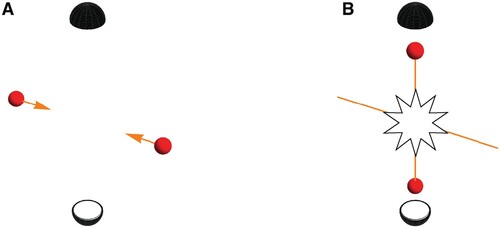
Figure 4. α-α scattering reported in Rutherford and Chadwick (Citation1927). The observed number of scattered particles at a angle (centre-of-mass frame) is plotted as the ratio to the number predicted by Rutherford's formula versus 1/E (the inverse of the collision energy E). From this Rutherford and Chadwick concluded that agreement was reached (ratio=1) in the low-energy limit (1/E large). The graph appeared as Figure in ‘The scattering of α-particles by helium’, E. Rutherford and J. Chadwick, The London, Edinburgh, and Dublin Philosophical Magazine and Journal of Science 4(22):605, 1927, reprinted by permission of the publisher (Taylor & Francis Ltd, http://www.tandfonline.com).
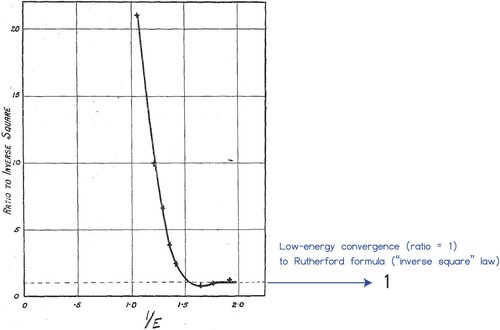
Figure 5. Crossed dipole trap. Atoms congregate at the laser beam intersection where the light intensity is the highest.
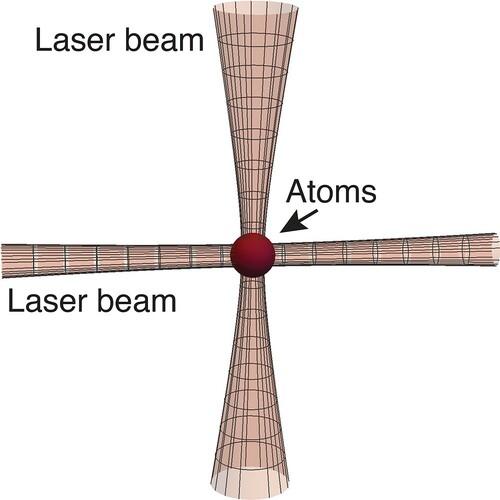
Figure 6. Collisions at K. A, Optical collider procedure.
atoms prepared in the internal quantum states
(red) and
(blue) are initially held by two separate cross beam traps. By steering the vertical tweezer laser beams the two clouds are accelerated along a horizontal guide beam into a collision, where a halo of scattered particle emerges. The distribution of scattered particles is detected using absorption imaging. B, Same procedure as A with the crucial difference that both clouds are in
. No scattering halo forms as result of combined action of Pauli exclusion and Wigner threshold suppression.
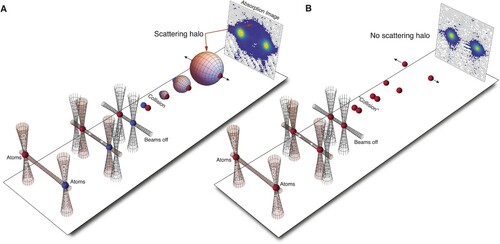
Figure 7. Collisions at K between two
atomic clouds using the procedure described in Figure . As the particles are indistinguishable fermions, a clear p-wave scattering halo forms as the collision energy is above the domain of
Wigner threshold suppression. The angular p-wave distribution governing the scattering halo is shown ar the right side.
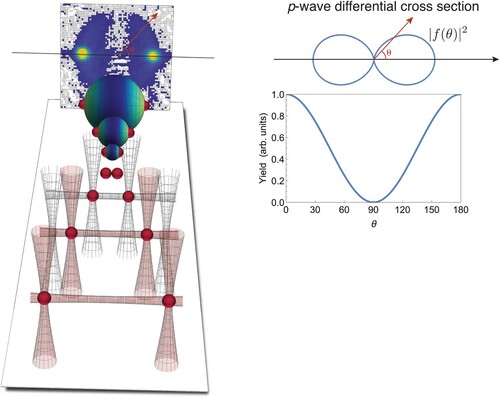
Figure 8. s-wave and d-wave scatering for in the internal state
(indistinguishable bosons). See main text for description. Figure reprinted from (Kjærgaard Citation2015) with permission.
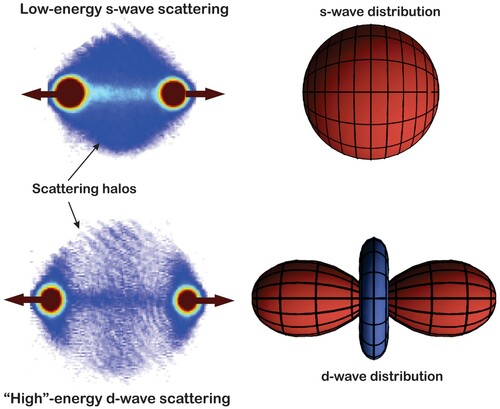
Figure 9. A, p-wave and s-wave angular distributions. The blue and red colours illustrate the antisymmetric and symmetric nature, respectively, of the two, with the amplitude of the p-wave changing sign under the operation of reflection in the origin. B, When adding up the s-wave and p-wave amplitudes one can obtain constructive inference in the forward or backward direction and destructive interference in the opposite direction. C, Experimental observation of s+p-wave interference for scattering of two clouds of in different internal states (
and
) at an energy
K (Mellish et al. Citation2007). Only atoms in the
are state-selectively imaged and we see that these are predominantly scattered in the forward direction. Of course,
atoms give rise to an additional scattering halo – invisible to the detection scheme – which predominantly travels in the opposite direction.
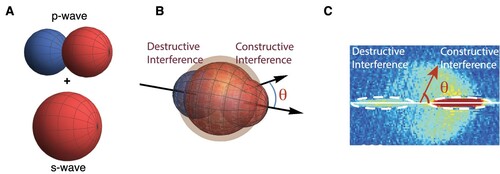
Figure 10. Rutherford at the 7th Solvay Conference on Physics held in Bruxelles, Belgium, October 22-29, 1933. The theme was the structure and properties of atomic nuclei. Previously (beginning 1911) he had been a participant at the 1st, 2nd, 3rd, and 4th Solvay Conferences on Physics (Mehra Citation1975; Hughes Citation1999). Seated left to right: E. Schrödinger, I. Joliot, N. Bohr, A. Joffe, M. Curie, P. Langevin, O.W. Richardson, Lord Rutherford, Th. DeDonder, M. deBroglie, L. deBroglie, L. Meitner, J. Chadwick. Standing left to right: E. Henriot, F. Perrin, F. Joliot, W. Heisenberg, H.A. Kramers, E. Stahel, E. Fermi, E. T. S. Walton, P. A. M. Dirac, P. Debye, N. F. Mott, B. Cabrera, G. Gamow, W. Bothe, P. Blackett (at back), M.S. Rosenblum, J. Errera, Ed. Bauer, W. Pauli, J. E. Verschaffelt, M. Cosyns (at back), E. Herzen, J. D. Cockcroft, C. D. Ellis, R. Peierls, Aug. Piccard, E. O. Lawrence, L. Rosenfeld. Photograph by Benjamin Couprie, Institut International de Physique Solvay, courtesy AIP Emilio Segrè Visual Archives, Leon Brillouin Collection. Copyright by Solvay Institutes. Reprinted with permission.
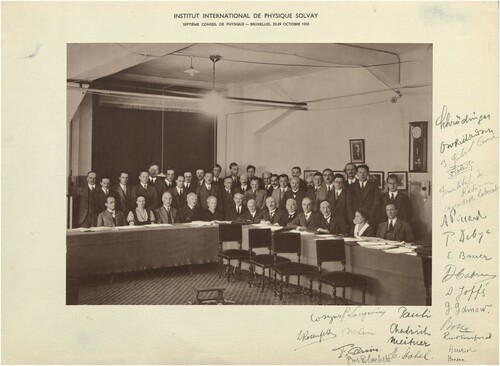
Figure A1. The result from three experiments on α-α scattering. ∙ Rutherford and Chadwick (Citation1927) reported that the ratio of observed scattering to that predicted by the Rutherford formula for would be unity for energies
MeV. ◦ Chadwick (Citation1930) found that the ratio would settle on a factor of 2 for energies
MeV. ■ Heydenburg and Temmer (Citation1956) found that Mott's prediction
only occurs for energies
MeV.
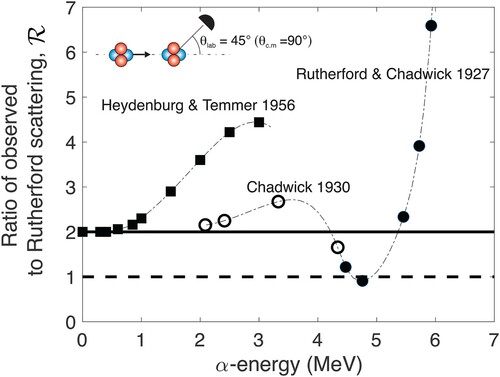
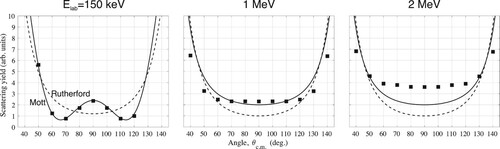
Figure A2. Angular scattering yield for collision energies (lab frame) 150 keV, 1 MeV, and 2 MeV. ■ are measurements from Heydenburg and Temmer (Citation1956) while lines show the predictions from Rutherford's fomula (dashed lines) and Mott's formula (full line.).