
Figures & data
Table 1. A typology of organisations and sources relevant to aviation emissions and leading instances drawn on in this study.
Figure 1. New Zealand aviation CO emissions, 1990–2020 (UNFCCC Citation2021). Note the rapid rise in emissions over the 4-year period 2015–2019, +40% for international and +20% for domestic emissions.
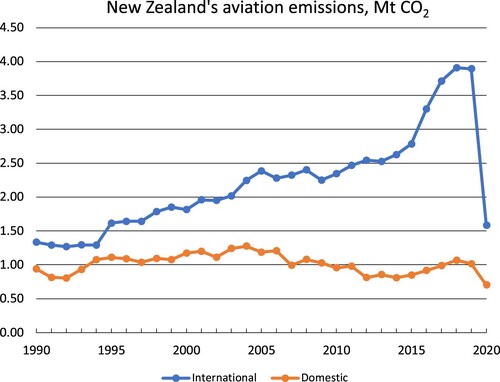
Figure 2. Model pathways for future cumulative CO emissions from New Zealand aviation under different growth rates r, with traffic returning to 2019 levels in 2023 and 20% efficiency gains and 100% SAF by 2050. The horizontal lines show the carbon budgets under two global temperature targets. The reference case refers to 2% annual growth using existing technology and fuel.
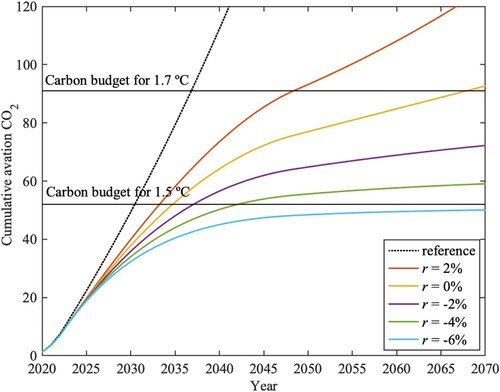
Table 2. Key aspects of New Zealand's aviation emissions.
Table 3. The proposals and estimates discussed in the text. The UK CCC data is their ‘Balanced Net Zero’ pathway. The ICCT estimate is based on the potential maximum technology and feedstock supply. The sustainable aviation fuel (SAF) proportions do not take into account the lifecycle emissions of the fuels (e.g. land use, processing, infrastructure, renewable energy).
Table 4. Six scenarios for New Zealand aviation, combining different traffic growth rates r, SAF proportion in 2050 s, and cap on traffic in 2023 c, that meet the IPCC carbon budget for 1.5C resp. 1.7
C (i.e. ‘well below 2
C’).