
Figures & data
Figure 1. Example images from the mussel farms at the Marlborough Sounds of New Zealand.
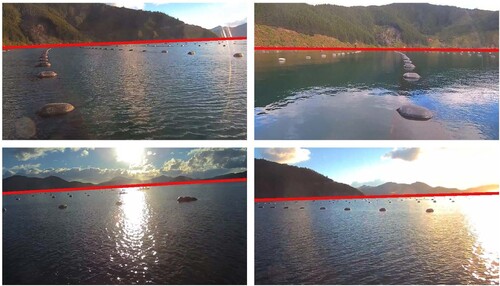
Figure 2. An example of a multi-object tracking task.
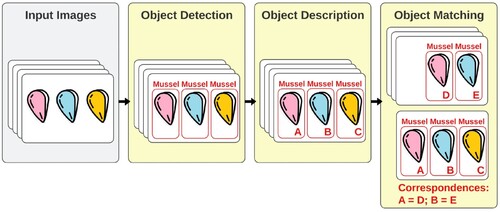
Figure 3. An example of image registration.
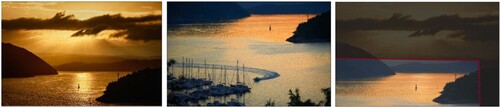
Figure 4. Flowchart of the proposed approach to mussel float tracking.
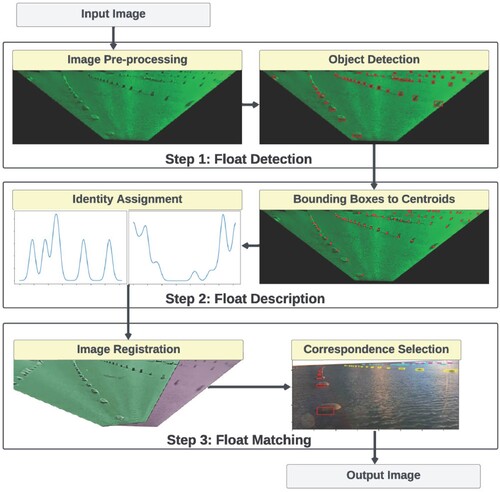
Figure 5. An illustration of the employed homography. The four corners of the original image are shown in black, while the corners after transformation are shown in red.
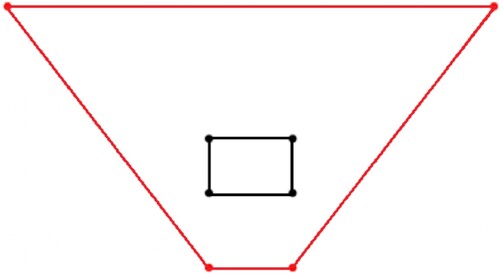
Figure 6. A demonstration of the preprocessing procedures. A, input image; B, the first grey-world colour equalisation; C, RGB to grey-scale; D, homomorphic filtering; E, the second grey-world colour equalisation; F, homography transformation.
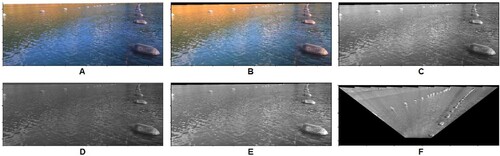
Figure 7. An illustrative example showcasing the Gaussian mixture models derived from the sets of true and relative bearings of the red dot.
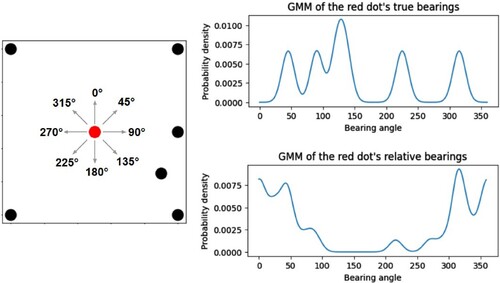
Figure 8. Flowchart of the proposed approach to mussel float matching.
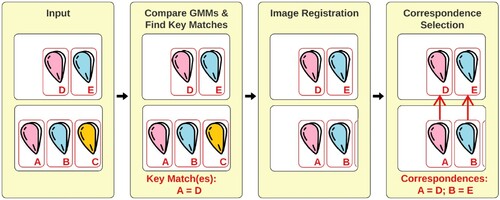
Figure 9. Example mussel farm images with the non-water region removed.
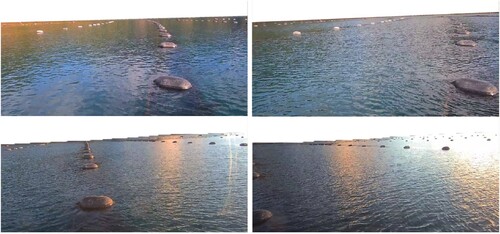
Table 1. The proposed pipeline and comparison methods.
Figure 10. Float detection results obtained by the new mussel float detector (left) and the YOLOv8 method (right) on the same image.
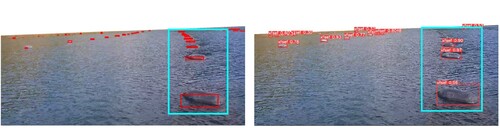
Table 2. Comparison of object detection methods
Figure 11. Float matching results using SIFT + LPM (top left), CPD + LPM (top right), and the proposed method (bottom) on the same image. Mismatches are indicated by red lines, and correct matches are indicated by green lines.
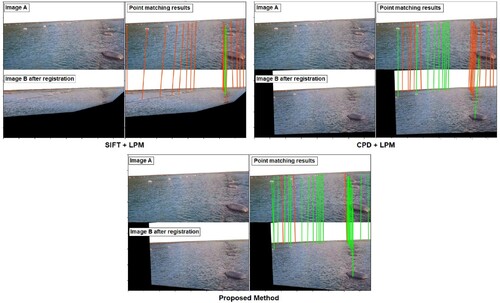
Table 3. Comparison of object description and matching methods using the ground truth correspondences.
Table 4. Comparison of the overall tracking performances.