
Figures & data
Figure 1. NZ national nutrient supply and food sources as a proportion of national requirement in 2020. Range bars represent safe upper intake levels (not shown when taking values greater than 3) and lower intake reference values (see methods), where available.
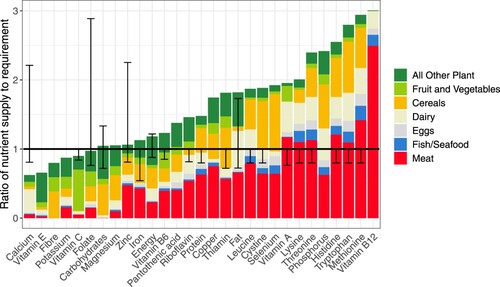
Table 1. National supply of nutrients as a % of national requirement under modelled scenarios. Values 105% or below are shown in bold.