
Figures & data
Figure 1. Price indices of food categories. Note: The shaded area in this and the following figures represents the period after the onset of the COVID-19 pandemic.
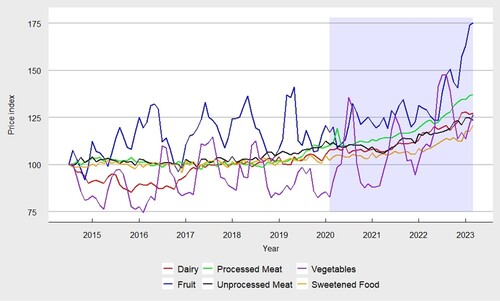
Figure 2. Twelve-month moving averages of food indices.
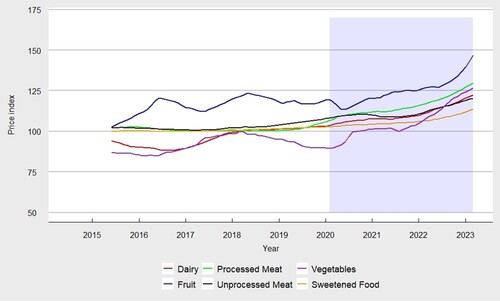
Figure 3. Twelve-month moving averages of normalised real food prices.
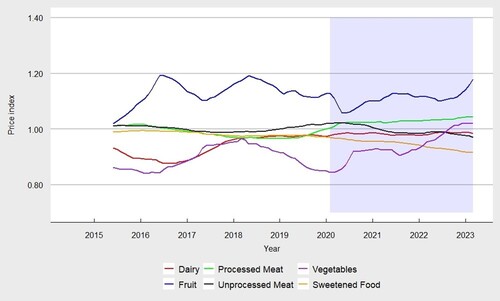
Figure 4. Twelve-month moving averages of relative real price of sweetened foods vis-à-vis other foods.
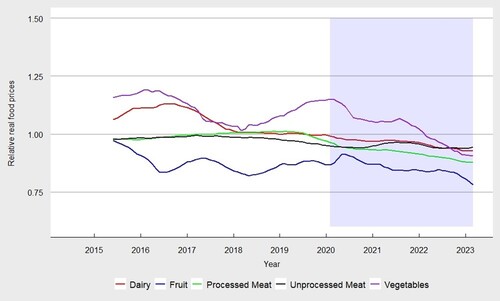
Table 1. Mann-Kendall tests and linear regressions.
Table A1. Food classifications