
Figures & data
Table 1. Background information of respondents.
Figure 1. Average of respondents’ ratings of the survey items with respect to the three aspects of interest (importance, development in studies, and development at work) by gender.
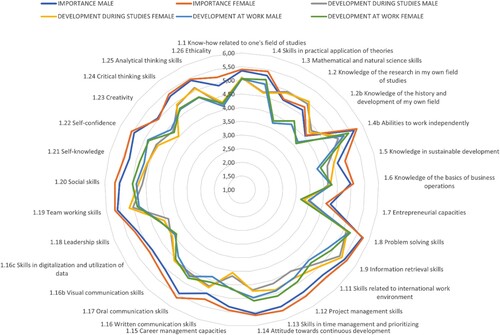
Table 2. Factors (see Appendix for full factor loadings of items).
Table 3. Statistical difference (Mann–Whitney U test) and effect size (Hedge’s g) of the difference between the responses of female and male respondents.
Table 4. Results of factor analysis: Combined means (scale: 1–6).
Figure 2. Combined mean scores (cumulative) for importance of Communication Skills by gender and field of education (Process & Materials Engineering and Industrial Management).
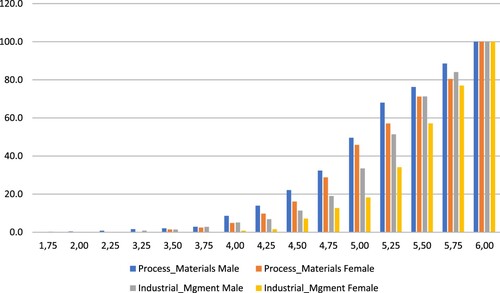
Table A1. Factor analysis results: Factors, included items and full factor loadings.