Figures & data
Figure 1. Distribution of participants' well-being scores.
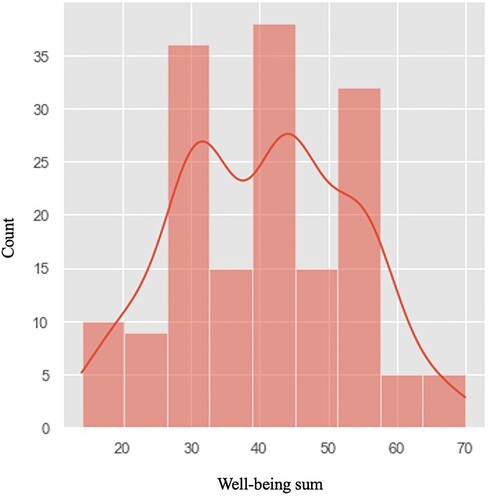
Table 1. Number of participants per well-being category (n = 165).
Figure 2. Well-being score distribution per student's degree.
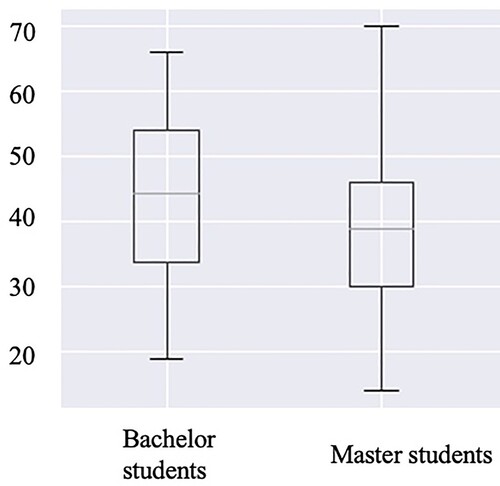
Figure 3. Well-being score distribution per availibility of suitable working enviornment.
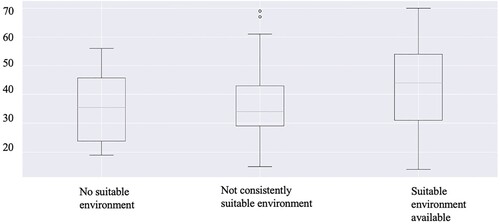
Figure 4. Course-experience related factors and their impact on well-being. Percentage distributions.
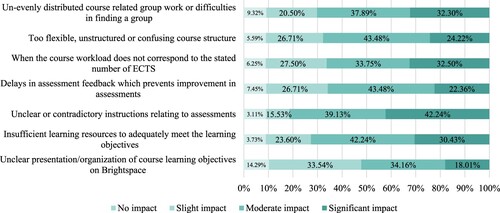
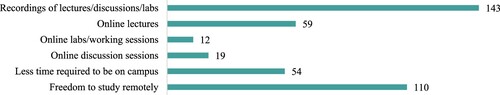
Figure 5. Course-experience related factors and their impact on well-being. Count of students indicating this topic has affected their well-being (n = 165).
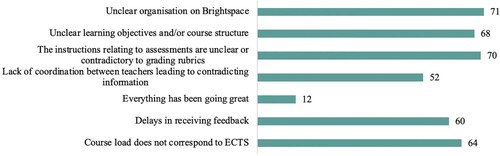
Figure 6. Thesis-related factors and their impact on well-being. Percentage distributions.
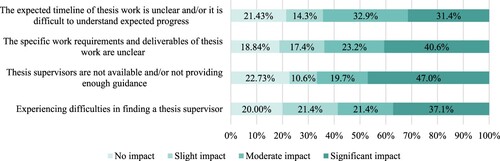
Figure 7. Thesis-related factors and their impact on well-being. Count of students indicating this topic has affected their well-being (n = 76).
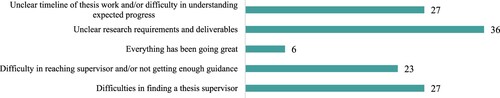
Figure 8. Communication-related factors and their impact on well-being. Percentage distributions.
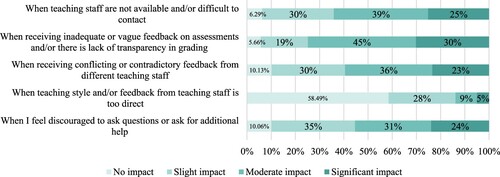
Figure 9. Communication-related factors and their impact on well-being. Count of students indicating this topic has affected their well-being (n = 165).
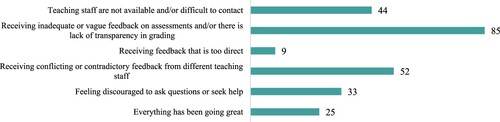
Figure 10. Environment-related factors and their impact on well-being. Percentage distributions.
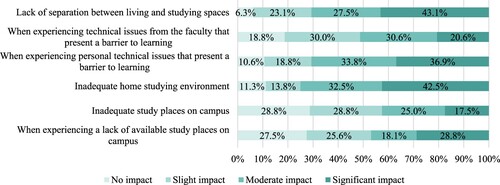
Figure 11. COVID-19-related factors and their impact on well-being. Percentage distributions.
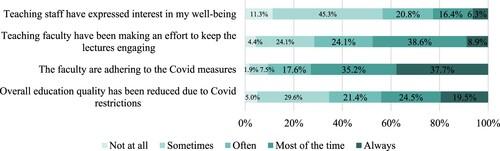
Figure 12. COVID-19-related well-being statements on students’ preferences post COVID-19 (n = 165).