
Figures & data
Figure 1. Outline of the development of the PPSA questionnaire through Studies I and II.
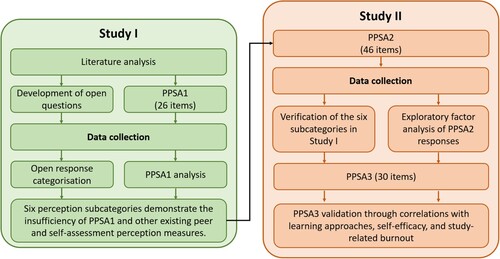
Figure 2. Percentages of different Likert-responses for perceptions of peer assessment (PA) in the PPSA1 and the mean values for each question. The response range at the bottom of the Figure is from Strongly disagree (= 1) to Strongly agree (= 5). Meanwhile, the superscripts after the items on the left indicate their source with 1 = Planas Lladó et al. (Citation2014) and 2 = Wen and Tsai (Citation2006).
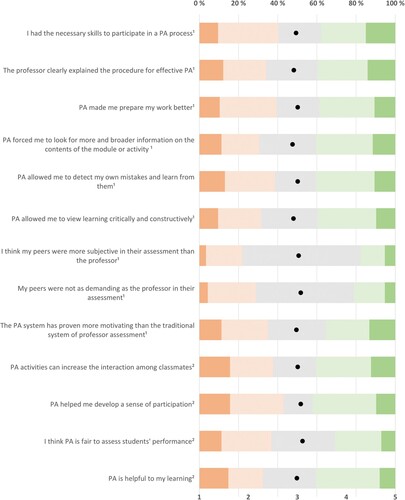
Figure 3. Percentages of different Likert-responses for perceptions of self-assessment (SA) in the PPSA1 and the mean values for each question. The response range at the bottom of the Figure is from Strongly disagree (= 1) to Strongly agree (= 5). Meanwhile, the superscripts after the items on the left indicate their source with 1 = Planas Lladó et al. (Citation2014) and 2 = Wen and Tsai (Citation2006).
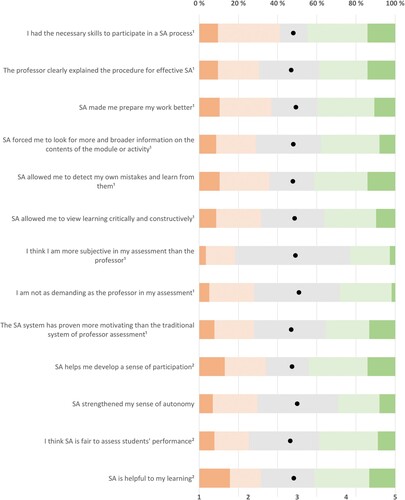
Table 1. Examples of characteristic responses in different open response categories for peer and self-assessment in the questionnaires.
Table 2. The relevant statistical EFA indicators for the PPSA2 and the PPSA3.
Table 3. The factors structure of the peer assessment items in PPSA3, together with the means, standard deviations, and McDonald’s omega values of the factors.
Table 4. The factors structure of the self-assessment items in PPSA3, together with the means, standard deviations, and McDonald’s omega values of the factors.
Table 5. Correlations between the peer and self-assessment factors in PPSA3 and the measures of learning approaches, study-related burnout, and general self-efficacy.