
Figures & data
Figure 1. Outline of how data was gathered and analysed.
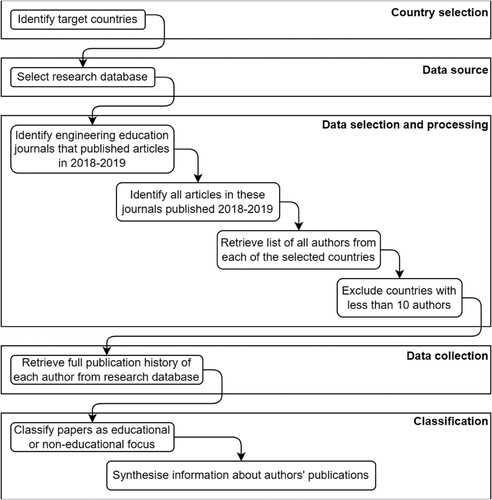
Table 1. EE journals included in the study.
Table 2. Summary of the number of authors from each country, and the total number of educational and non-educational papers by authors from each country (authors from 13 EER journals).
Table 3. Number of authors from each country who published in Q1 engineering education journals in 2018–2019 (based on Scimago rankings).
Table 4. Distribution of publications as educational or non-educational, categorised by country. N represents the number of authors from that country.
Table 5. Distribution of publications by type, categorised by country. N represents the number of authors from that country.
Table 6. Comparison of the h-index of all publications, only educational publications, and only non-educational publications, based on mean value of individual authors from each country. N represents the number of authors from that country.
Table 7. Ranking of EE publications in Q1 journals with output in global scientific and engineering domains.