
Figures & data
Figure 1. Illustration of the research approach. The black boxes describe the data collected from the students. The yellow boxes describe the methods of data collection. The red boxes describe the analysis.
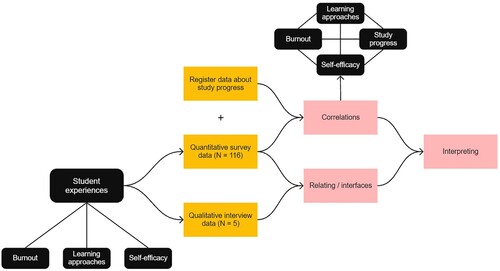
Figure 2. Number of respondents and response rates of each cohort in years 2021, 2022 and 2023 are described in the arrows. Total number of respondents and the total response rate of all the cohorts is described in the box on the right.
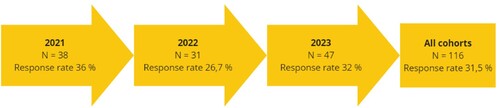
Table 1. Description of the codes used in the analysis of the interviews.
Figure 3. Correlations between burnout, self-efficacy, learning approaches and study progress. The lines describe the significant correlations found, and the dotted lines describe almost significant correlations. (* p-value < .05, ** p-value < .01, *** p-value < .001).
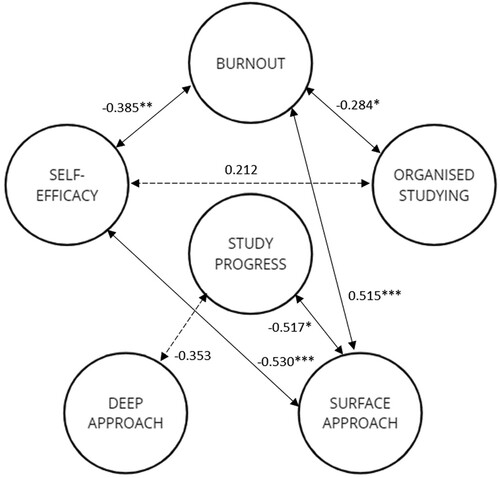
Table A1. Total number of respondents and total number of all students in each year and in each study programme, and response rates of each group.