
Figures & data
Figure 1. Overview of tasks and models.
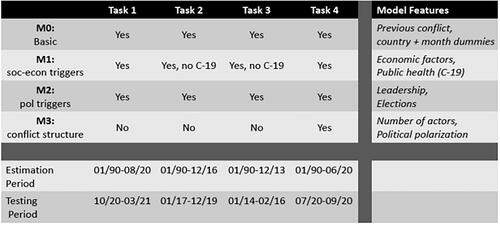
Figure 2. ViEWS Benchmark and own model for the forecasting period 10/20–03/21, based on data up to and including August 2020 (Task 1 MSE).
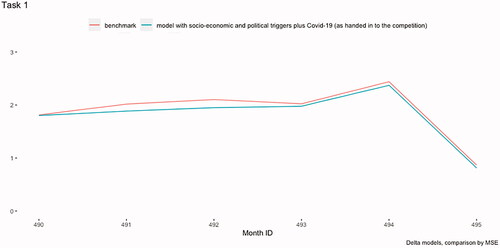
Figure 3. Calibrated models for the estimation period 01/90–12/16 and the forecasting period 01/17–12/19 (Task 2 MSE).
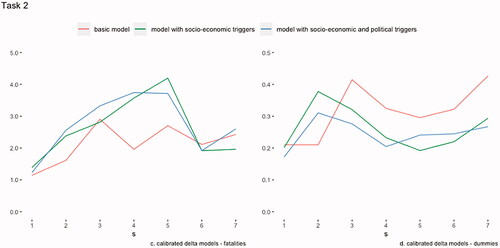
Figure 4. Calibrated models for the estimation period 01/90–12/13 and the forecasting period 01/14–12/16 (Task 3 MSE).
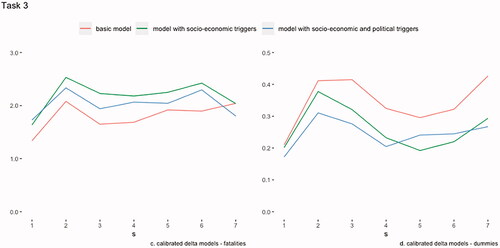
Figure 5. Calibrated models for the estimation period 01/90–06/20 and the forecasting period 07/20–9/20 (Task 4 MSE).
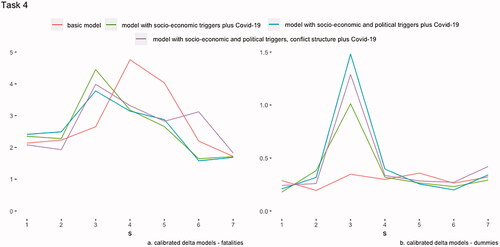
Figure 6. Changes in fatalities, South Sudan.
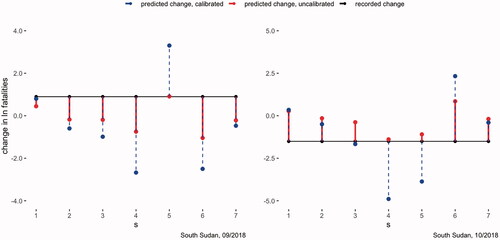
Table 1. Feature importance for model 3 in task 4.
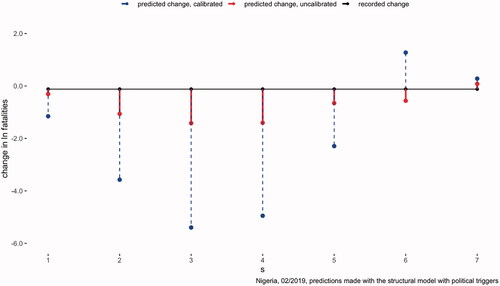
Figure 7. Changes in fatalities, Nigeria.
Supplemental material