Figures & data
Table 1. Partitioning of data for estimating model weights, hyperparameter tuning, evaluation, and forecasting.
Table 2. Evaluation scores for the benchmark and no-change models by step, cm.
Table 3. Evaluation scores for the benchmark and no-change models by step, pgm.
Figure 1. Maps of predicted change from September 2020 through March 2021, cm.
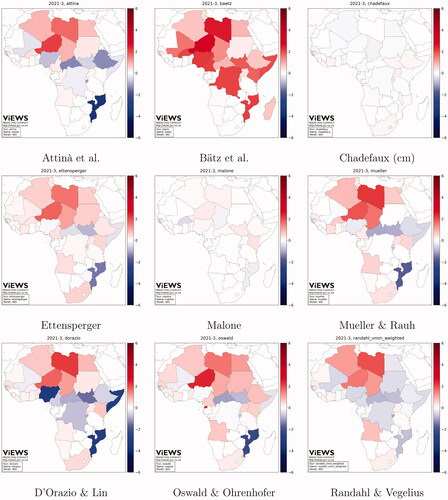
Figure 2. Maps of predicted change from September 2020 through March 2021, pgm.
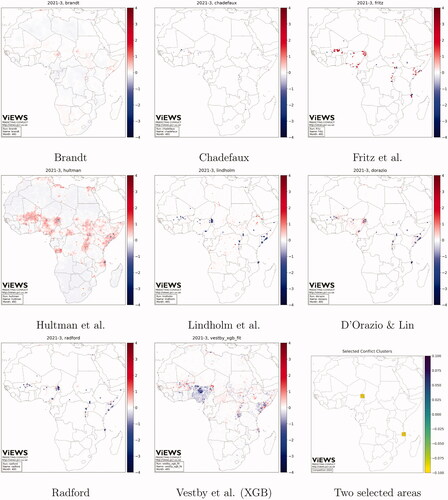
Figure 3. Maps of observed change in fatalities from September 2020 to October 2020 (left), and March 2021 (right), cm (top), and pgm (bottom).
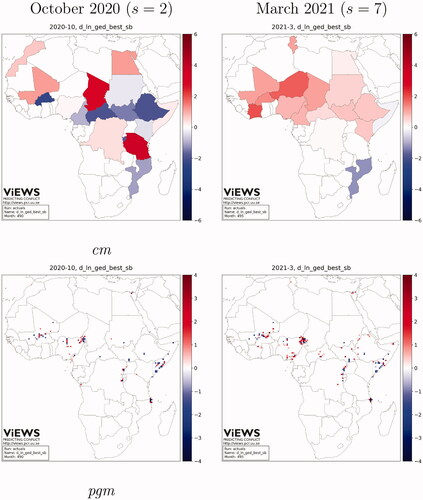
Figure 4. Predicted change from September 2020 through March 2021, for selected countries.
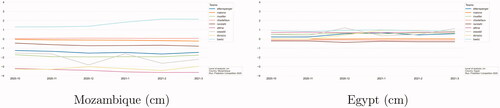
Figure 5. Predicted change from September 2020 through March 2021, for selected groups of grid cells (bottom).
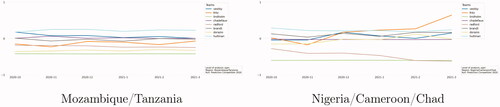
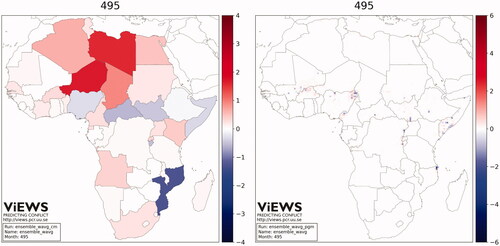
Figure 6. Maps of predicted change from August 2020 through March 2021, weighted ensemble of the contributions, cm (left), and pgm (right).