Figures & data
Figure 1. Examples of Choice Task for Men and Women Shoppers in the US Sample.
Note: For respondents that identified as female, we displayed images with a different style of t-shirt.
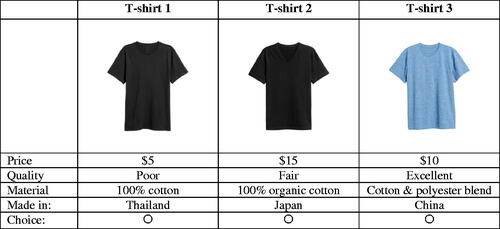
Figure 2. Examples of Choice Task for Respondents in the India Sample.
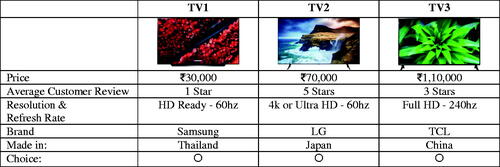
Table 1. Perception of threat by country (percentage).
Figure 3. Conjoint with Political Relations (US Sample—T-Shirt).
Note: The hollow circles with blue bars indicate the AMCE and their 95% confidence intervals. The hollow circles without blue bars indicate the baseline attribute. N = 15,435
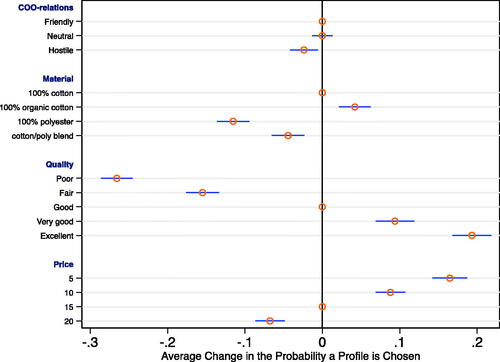
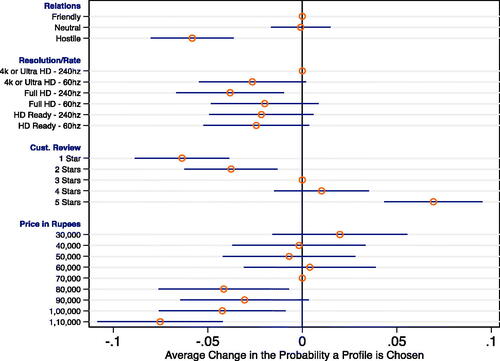
Figure 4. Conjoint with Political Relations (India Sample—Television).
Note: The hollow circles with blue bars indicate the AMCE and their 95% confidence intervals. The hollow circles without blue bars indicate the baseline attribute. We exclude the brand category to improve the presentation of the results. Brand had a minimal impact on consumer choice. N = 13,485.