
Figures & data
Figure 1. Schematic view of a self-compensating assembly line.
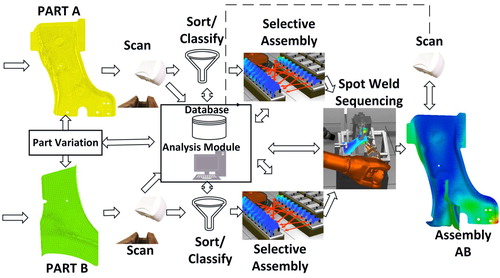
Figure 2. Three sheet metal reference assemblies. (a) Assembly II, (b) Assembly III.
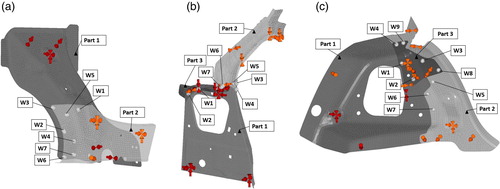
Table 1. Optimal sequence, assembly deviation (in millimetres) and evaluation time of the reference assemblies from the exhaustive search.
Figure 3. Mean number of function evaluations (NFEs) for different population sizes in 100 trials.
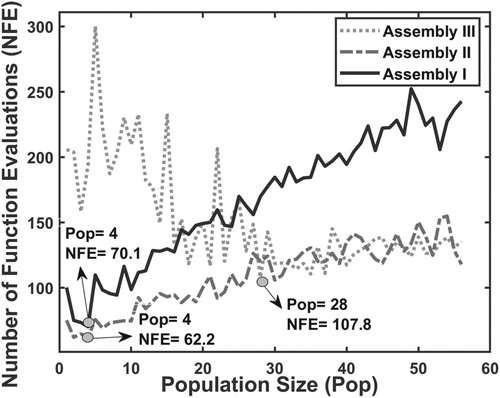
Figure 4. Mean number of function evaluations (NFEs) (left column) and assembly deviation range (right column) for different population sizes in 100 trials between the compared algorithms for Assembly I.
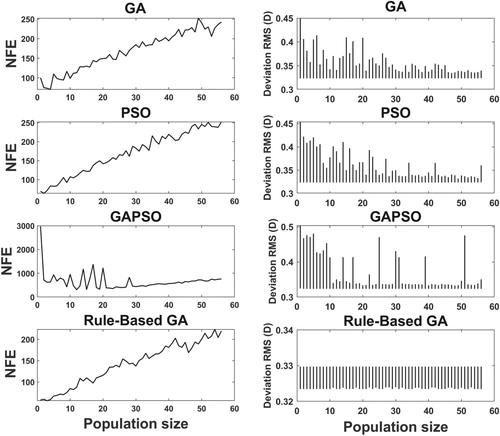
Figure 5. First step of the stepwise algorithm with one and two elements compared to the exhaustive search.
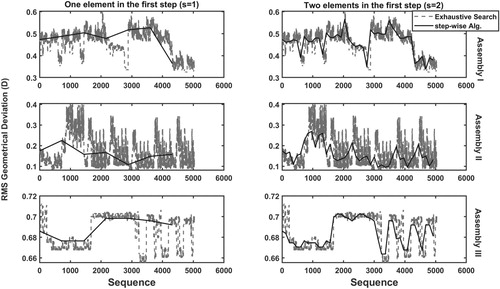
Figure 6. Optimization steps using the stepwise algorithm.
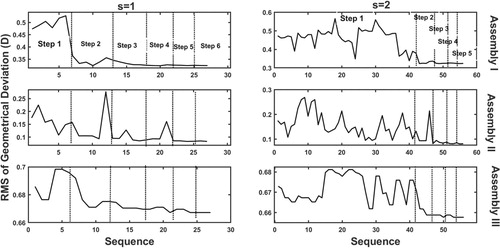
Table 2. Optimal sequence and the assembly deviation (in millimetres) of the reference assemblies retrieved from the stepwise algorithm with s = 1 and s = 2.
Table 3. Evaluation time comparison.
Table 4. Accuracy comparison.
Supplemental material