Figures & data
Figure 1. (a) Annual average of fuel consumption, where gasoline gallons equivalent (GGEs) denote the amount of combustible fuel (e.g. diesel or electricity) it takes to equal the energy contained in a gasoline gallon. (b) Transit buses that travel with few passengers have been shown to produce more greenhouse gas emissions per passenger mile than private cars (EPA Citation2020).
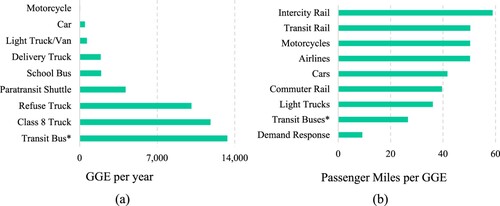
Figure 2. Route 217 Los Angeles. (a) Route map with stops markers and a maximum passenger load of 481 people in Fairfax/Rosewood between 17:00 and 18:00. (b) User demand ride-check data for 19 periods of 60 min for a total of 59 stops (Ceder Citation2016). (c) Route elevation profile with the highest gradient of 6% slope at 2.2 km (northbound). The data set can be downloaded from GitHub (https://github.com/davidpmorales/MVTTP).
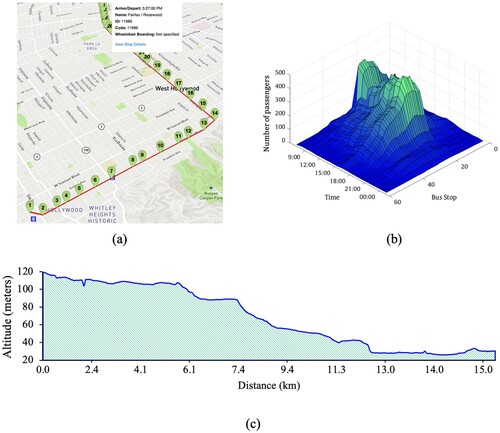
Figure 3. Graphic representation of the solution space, objective space and Pareto front.
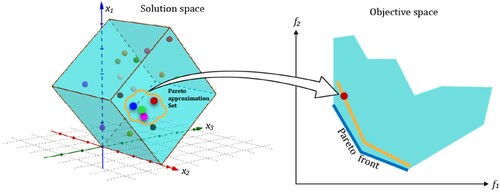
Figure 4. Reproduction steps in the cellular genetic algorithm for multi-objective optimization (MOCell) using spheres representing different solutions. The array attached to each sphere is the genotype of an individual, and its phenotype represents the departure times and vehicle type defined in the timetable computed by the proposed approach to solve the multiple vehicle-types timetabling problem (MVTTP).
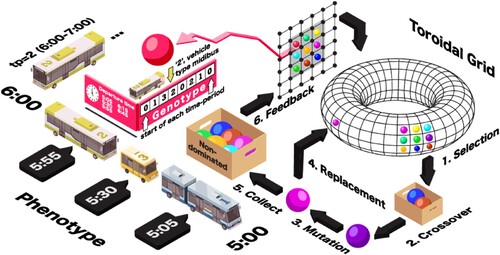
Figure 5. Example of unsatisfied user demand given two different vehicle assignments.
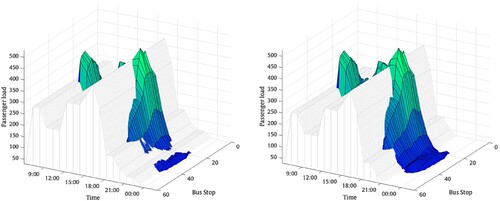
Figure 6. Ranking of the configurations of the studied algorithms using the Friedman test according to performance (dark red represents better rank value). SPX = single-point crossover; TPX = single-point crossover; DX = discrete crossover; UX = uniform crossover; HUX = half uniform crossover; RPM = reset period mutation; UM = uniform mutation; OGPPM = one gene per period mutation.
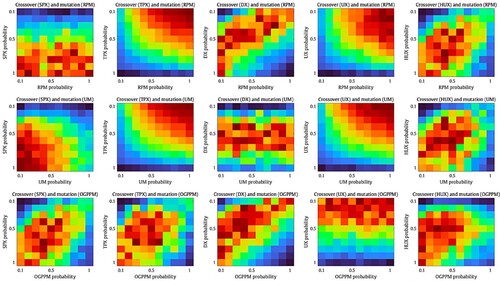
Figure 7. comparison for the 15 different parameter configurations of the cellular genetic algorithm for multi-objective optimization (MOCell). SPX = single-point crossover; TPX = single-point crossover; DX = discrete crossover; UX = uniform crossover; HUX = half uniform crossover; RPM = reset period mutation; UM = uniform mutation; OGPPM = one gene per period mutation.
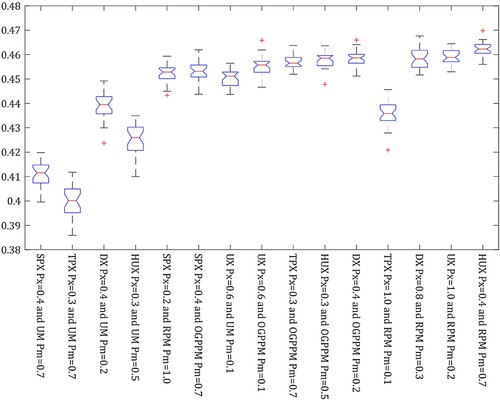
Table 1. Summary of related research on timetabling and bus scheduling.
Table 2. Parameter configuration of the multi-objective evolutionary algorithms (MOEAs).
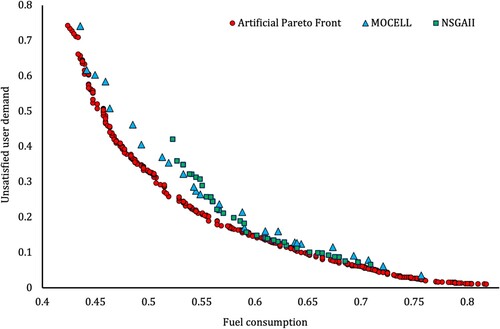
Figure 8. (a) Hypervolume performance metric convergence for the cellular genetic algorithm for multi-objective optimization (MOCell) in each independent run. (b) Comparison of the best approximation fronts computed by both algorithms. NSGA-II = non-dominated sorting genetic algorithm-II.
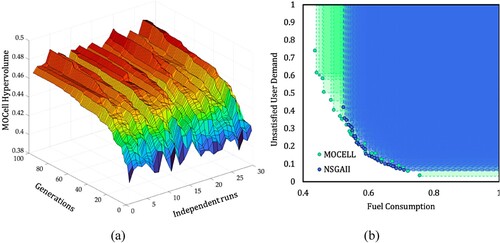
Table 3. Metric performance results considering 30 independent runs for each algorithm.
Figure 9. Comparison of fuel consumption rates from two non-dominated solutions, considering a heterogeneous bus fleet, an extreme solution with only minibuses and the observed vehicle dispatch using only standard buses for the 217 bus route in Los Angeles.
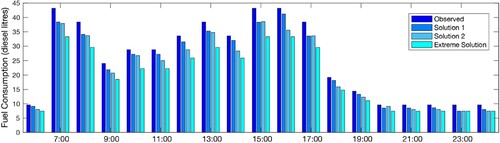
Figure 10. Best solution sets for the non-dominated sorting genetic algorithm-II (NSGA-II) and cellular genetic algorithm for multi-objective optimization (MOCell) (square and triangle marks, respectively). Dot marks represent the artificial Pareto front built using the best individuals of the 45,000 algorithm executions performed in this work.