
Figures & data
Table 1. Terminology.
Figure 1. Sample demonstration of PRSAT with four digits shown.
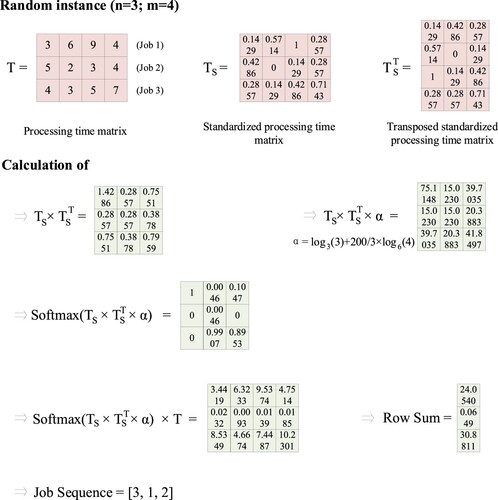
Table 2. Complexities and running times (in seconds) of priority rules.
Table 3. Average relative percentage deviation (ARPD) values of priority rules with the Taillard benchmark.
Table 4. Average relative percentage deviation (ARPD) values of priority rules with the VRF benchmark.
Table 5. Average relative percentage deviation (ARPD) values of priority rules with random instances.
Table 6. Paired sample t-test results of priority rules, with 95% confidence intervals (CIs).
Figure 2. Average relative percentage deviation (ARPD) values of each combination with the Taillard benchmark.
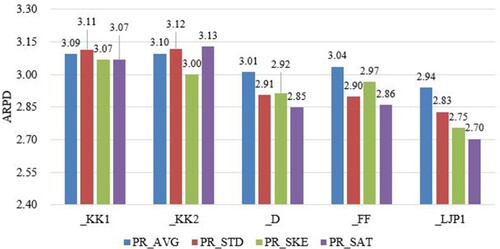
Figure 3. Average relative percentage deviation (ARPD) values of each combination with the VRF benchmark.
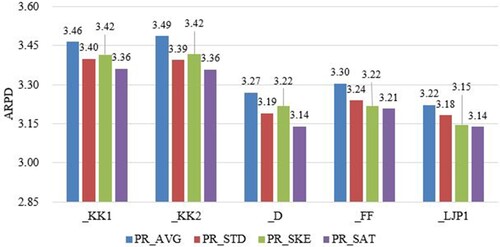
Figure 4. Average relative percentage deviation (ARPD) values of each combination with random instances.
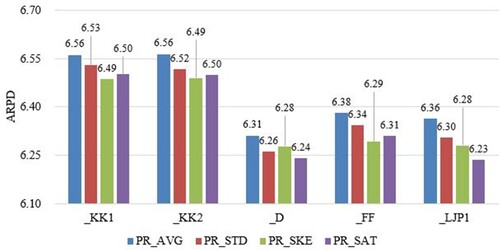
Table 7. Average relative percentage deviation (ARPD) values of heuristics with the Taillard benchmark.
Table 8. Average relative percentage deviation (ARPD) values of heuristics with the VRF benchmark.
Table 9. Average relative percentage deviation (ARPD) values of heuristics with random instances.
Table 10. Paired sample t-test results of heuristics, with 95% confidence intervals (CIs).
Figure 5. Average relative percentage deviation (ARPD) versus average relative percentage time (ARPT) of heuristics on a logarithmic scale on the Taillard benchmark.
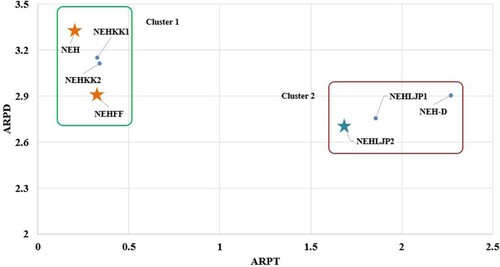
Figure 6. Average relative percentage deviation (ARPD) versus average central processing unit time (ACPU) of heuristics on a logarithmic scale on the Taillard benchmark.
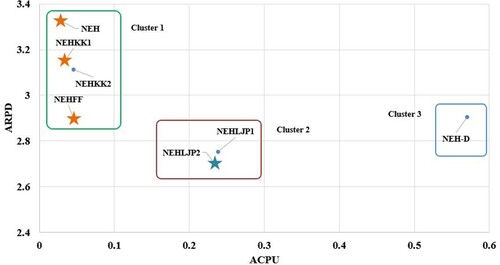
Figure 7. Average relative percentage deviation (ARPD) versus average relative percentage time (ARPT) of heuristics on a logarithmic scale on the VRF benchmark.
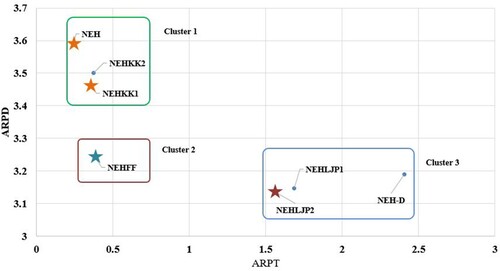
Figure 8. Average relative percentage deviation (ARPD) versus average central processing unit time (ACPU) of heuristics on a logarithmic scale on the VRF benchmark.
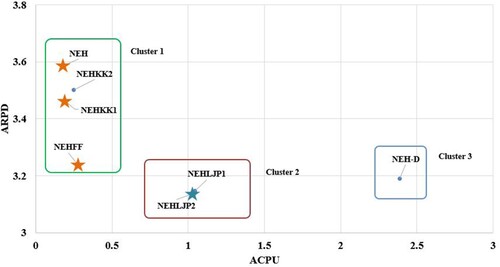
Figure 9. Average relative percentage deviation (ARPD) versus average relative percentage time (ARPT) of heuristics on a logarithmic scale on random instances.
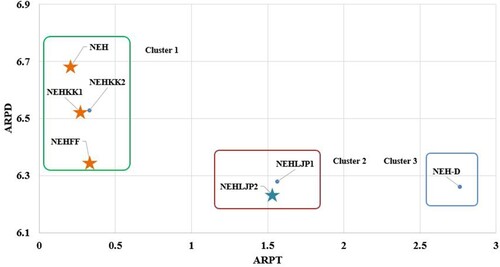
Figure 10. Average relative percentage deviation (ARPD) versus average central processing unit time (ACPU) of heuristics on a logarithmic scale on random instances.
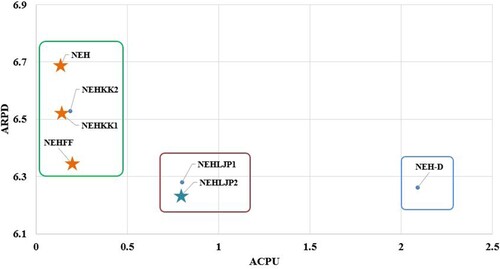
Figure 11. Heuristic performance with the iterated greedy (IG) algorithm.
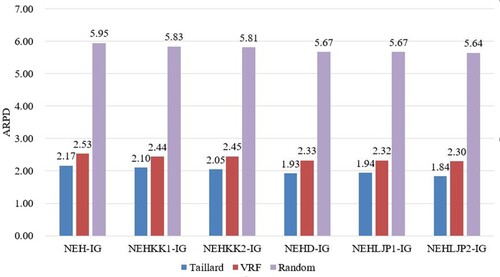
Table 11. Paired sample t-test results of heuristics with the iterated greedy (IG) algorithm.
Data availability statement
The data sets generated in the current study are available in the Mendeley Data repository, doi: 10.17632/gx8657vph2.1.