Figures & data
Table 1. Descriptive statistics for the analytical sample, by birth cohort
Figure 1. Historical context of the sampled birth cohorts.
Note: the graph should be read from left to right: birth cohorts pass though historical periods.
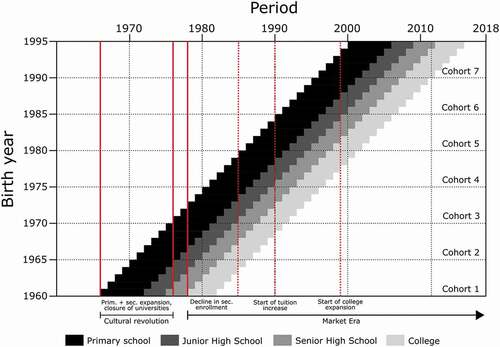
Table 2. Results from the sequential logit models: odds ratios, by birth cohort
Figure 2. Average conditional transition probabilities, by birth cohort and parents’ education.
Note: Average predicted transition probabilities from weighted sequential logit models including parental education, parents’ Communist party membership, hukou status and gender as predictors.
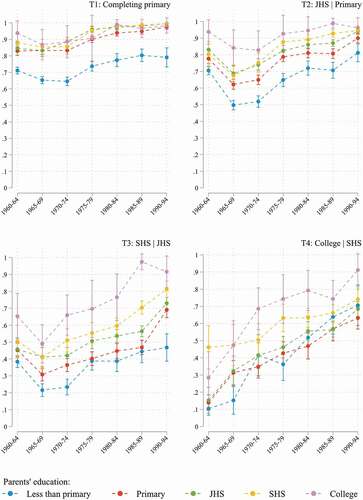
Figure 3. Average conditional transition probabilities: by birth cohort and household registration at age 12.
Note: Average predicted transition probabilities from weighted sequential logit models including parental education, parents’ Communist party membership, hukou status and gender as predictors.
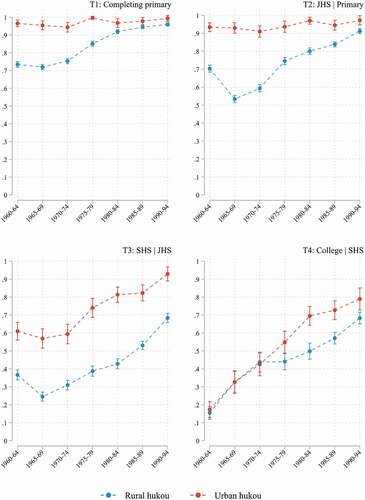
Figure 4. Average conditional transition probabilities: by birth cohort and parents’ party membership.
Note: Average predicted transition probabilities from weighted sequential logit models including parental education, parents’ Communist party membership, hukou status and gender as predictors.
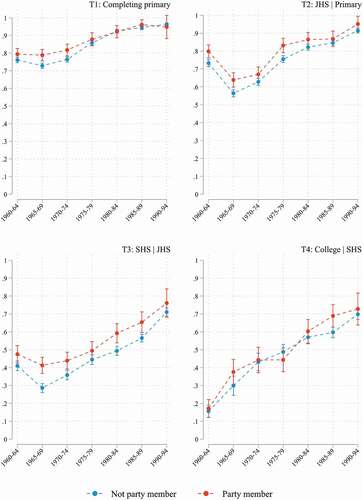
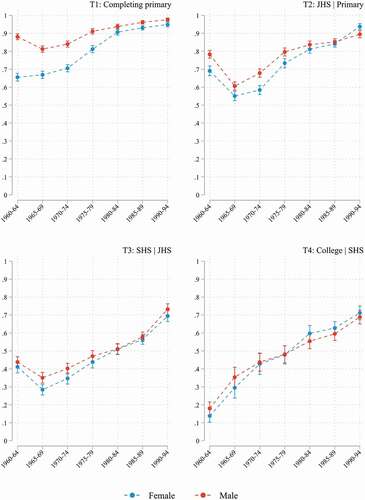
Figure A1. Average conditional transition probabilities: by birth cohort and gender.
Note: Average predicted transition probabilities from weighted sequential logit models including parental education, parents’ Communist party membership, hukou status and gender as predictors