Figures & data
Table 1. Sugar cane area, production and yield in southern Africa, 1992–2012
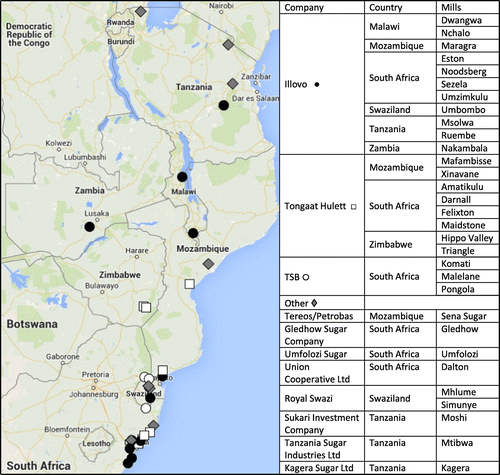
Figure 1. Corporate dispersal of sugar operations across Southern Africa. Sources: Google Maps, with coordinates from The Sugar Engineers consultancy, ‘Sugar Factories of Southern Africa’ (Grahamstown, The Sugar Engineers, 2014), available at http://www.sugartech.co.za/factories/list.php?regid=7, retrieved 20 October 2014.

Table 2. Sugar output in southern Africa
Table 3. Contributions to sugar operating profits
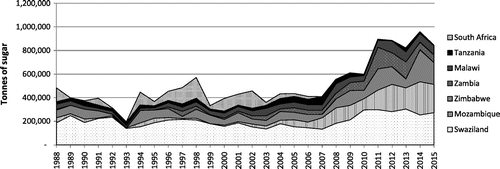
Figure 2. Southern African sugar exports to the EU by country, 1988–2015. Source: European Commission, ‘Eurostat’ (Brussels, European Commission, 2016), available at http://ec.europa.eu/eurostat/data/database, retrieved 6 July 2016.

