
Figures & data
Figure 1. Map of Mvurwi farming area in Mazowe district.
Source: APRA, 2020.
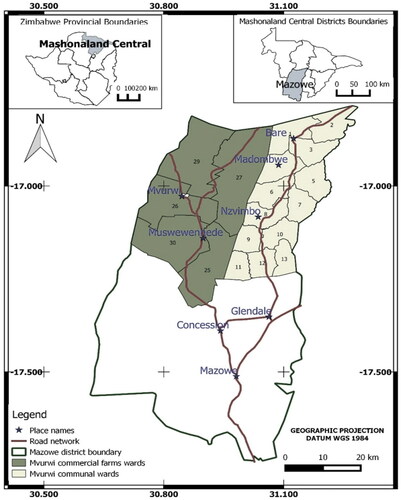
Table 1. Farmer typology (six clusters) in relation to the six principal component variables.
Table 2. Farmer typology (six clusters) in relation to pre-land reform occupation.
Table 3. Age profiles and educational qualification of household heads.
Table 4. Crop production and sales, 2016–17.
Table 5. Average asset ownership per household.
Figure A1. Scree plot.
Source: APRA, 2020.
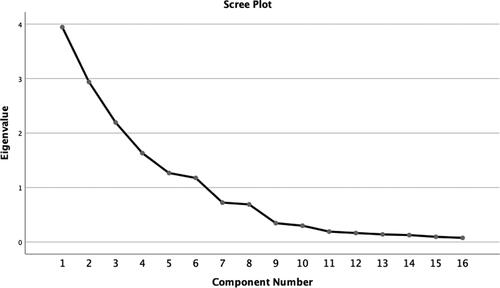
Table A2. Description of variables used in PCA and communalities variable extraction (those shaded are the 6 PCs retained using Kaiser’s criteria).
Table A3. KMO and Bartlett’s Test.
Table A1. Extraction method: principal component analysis (total variance explained).