
Figures & data
Figure 1. Map showing the NPAs, Reserves and Crown Land in Southern Rhodesia, 1931–1962. (Source: Adapted from Native Department, reproduced by H.A. Cartography, April 2020.)
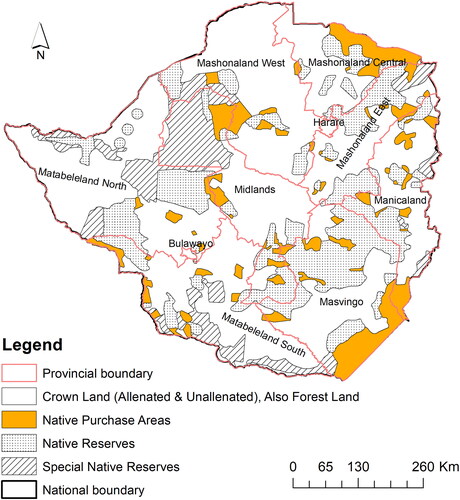
Figure 2. Number of Africans in NPAs in Southern Rhodesia, 1936–1960. (Source: PRO DO 64/25-88, Chief Native Commissioner Reports, 1936–1960.)
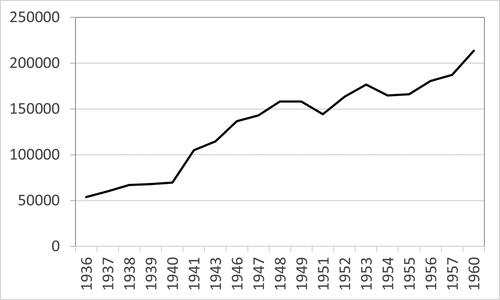
Table 1. Estimated maize yields per acre (203-lb bags) in native reserves and Native Purchase Areas (NPAs), 1951–1958
Table 2. Farm implements in Darwin and Chiweshe
Table 3. Total hours worked per crop in Chiweshe and Darwin
Table 4. Hours worked per acre, crop and operation in Chiweshe and Darwin
Table 5. Hours worked per farm by labour group and crop