
Figures & data
Table 1. List of the 23 selected articles reviewed in this study.
Figure 1. Study selection chart (Adapted from Moher et al.’s (Citation2009) PRISMA Framework.
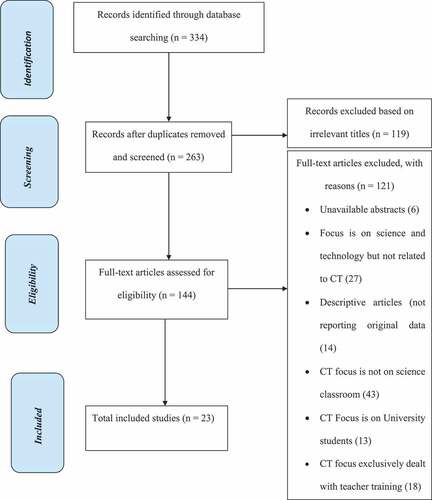
Figure 2. Article distribution based on the methodology.
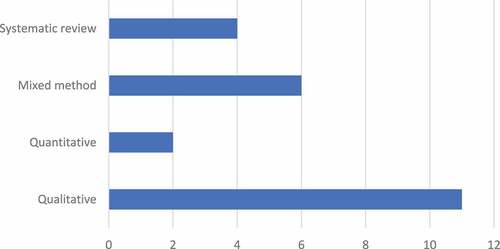
Table 2. Distribution of Data Collection Methods.
Figure 3. Article distribution based on subject areas.
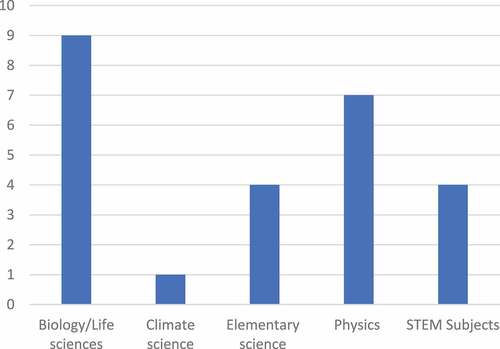
Figure 4. Article distribution based on the school level.
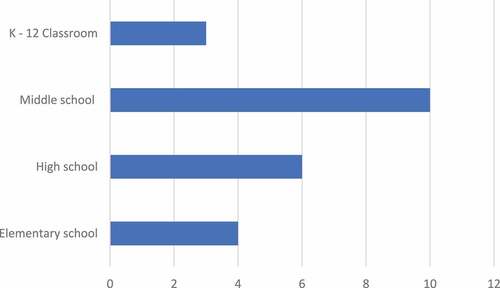
Table 3. Summary of constructs used in incorporating CT in science teaching.
Table 4. Categories of strategies used in integrating CT in science classrooms.
Table 5. Summary of tools used in integrating CT.
Table 6. Distribution of assessment techniques.