Figures & data
Figure 1. Virchow et al.’s biomass-based value web.
Source: Virchow et al. (Citation2014) as cited in Rural 21 (Citation2014, n. p.).
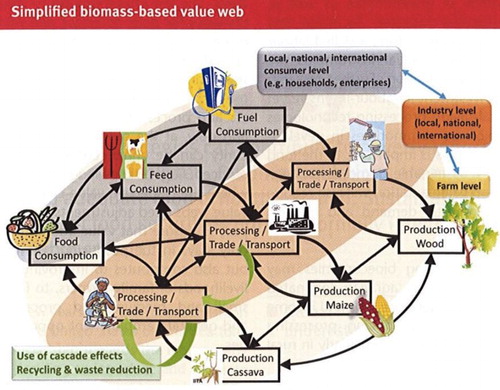
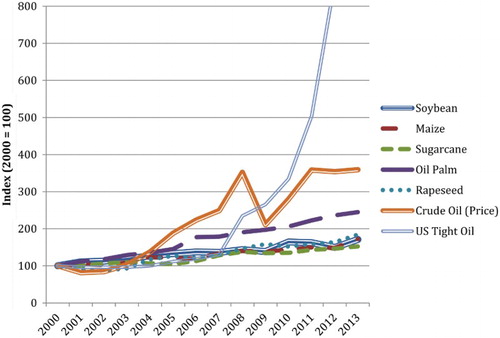
Figure 2. Changes in Crude Oil Prices, the Production of U.S. Shale Oil, and the Global Production of Major Flexible Biofuel Feedstocks (2000–2013).
Notes: Data for soybean, maize, sugarcane, oil palm, and rapeseed all refer to global production; crude oil prices refer to the U.S. crude oil first purchase price; oil shale production refers to the production of U.S. tight oil. All values are indexed to the year 2000.
Sources: FAOSTAT Citation2015; U.S. Energy Information Administration Citation2015a; and U.S. Energy Information Administration Citation2015b.
Sources: FAOSTAT Citation2015; U.S. Energy Information Administration Citation2015a; and U.S. Energy Information Administration Citation2015b.