
Figures & data
Figure 1. Area of sugarcane production in Guangxi (1980–2020). Source: National Bureau of Statistics.
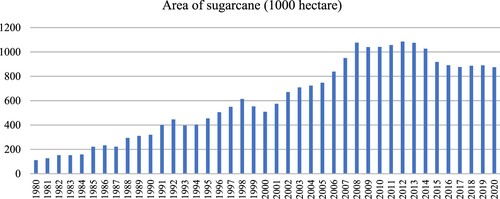
Figure 2. Patchwork landscape of sugarcane plantations in Guangxi. Source: google earth.
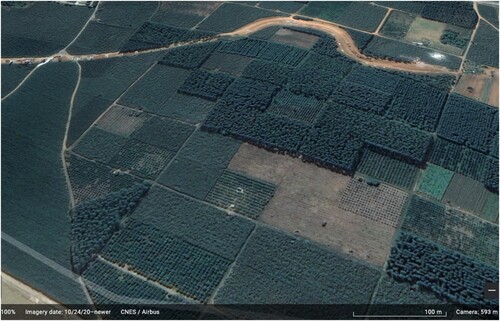
Figure 3. Distribution of farmland area in B Village.
Notes: total farmland area of the village = 206.6 ha (3100 mu); total number of households = 118. Data source: Field notes, 8 January 2016.
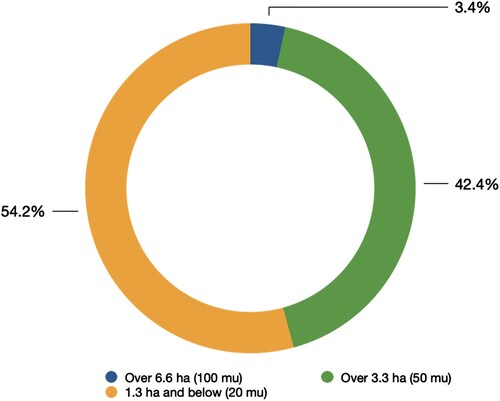
Table 1. Labor and input costs for sugarcane production.
Table 2. Zone areas for each sugar company in F County, 2020.
Table 3. Measures taken by sugar companies under the zoning scheme in Guangxi.
Figure 4. Sugarcane price and plantation area in Nanhua Mill, Guangxi (2001–2017). Data source: NanHua Sugar Mill (field notes in 2016, 2018 and online interviews in 2020).
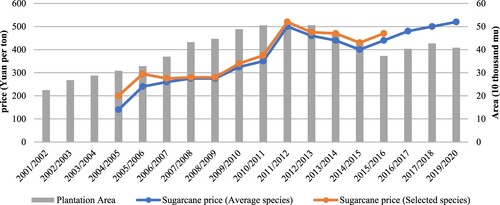
Table 4. Labor price of sugarcane cutters in Guangxi.