
Figures & data
Figure 1. Map of Nyamagabe (study region) in Rwanda.
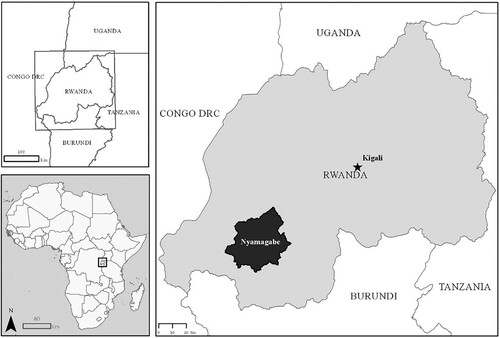
Figure 2. Rendition of a spatially and temporally heterogeneous agroecology in twentieth century Rwanda. Figure from Ford (Citation1990).
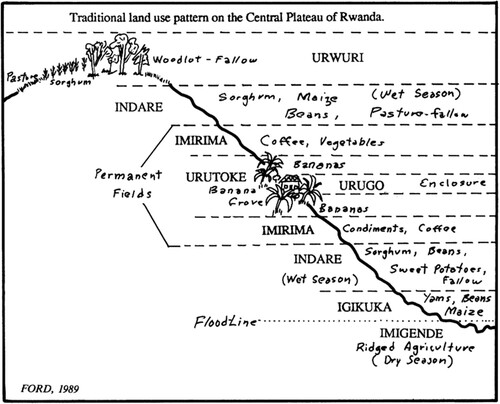
Table 1. Relative asset classes and correlating characteristics of survey respondent households. Each grouping of household was found to be significantly different (p < .01) from the others in terms of the factors in the leftmost column. Note that these data are based on participant responses to survey questions.