Figures & data
Figure 1. Trends in Selected Key Themes, 1970–2020.
Note: Figure generated using ngramr and ggplot2 packages in R 4.2.1.Footnote27
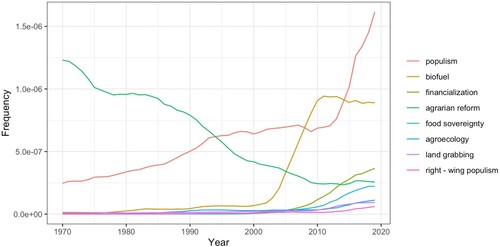
Figure 2. Geographical Location of Submitting Authors, JPS, 2012-2021.
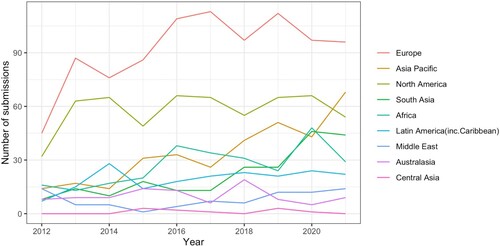
Figure 3. Geographical Location of Corresponding Authors, JPS, 2012-2021.
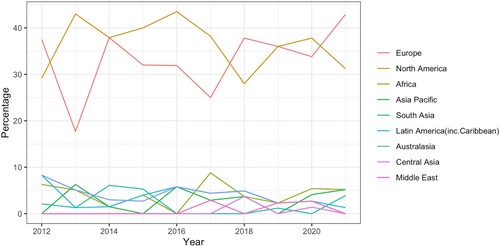
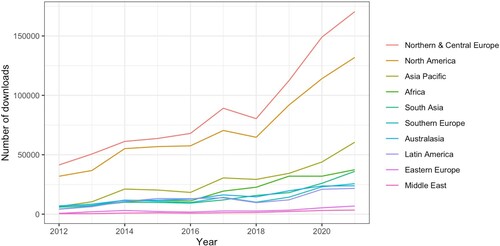
Figure 4. Regional Usage, JPS, 2012-2021.