Figures & data
Figure 1. Basic price theory applied to illicit drugs. A government crackdown on drugs removes supplies in the market, resulting in lower volumes (Q2) and higher prices (P2). Supply-side interventions move the supply curve up and leftwards (Source: Reuter 2019: 19).
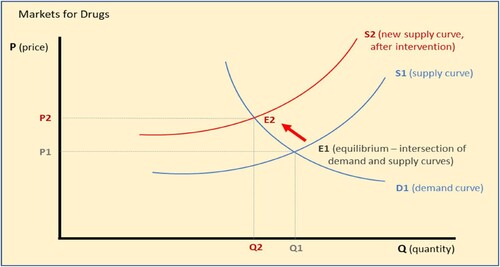
Figure 2. Intermediation margin. Intermediation, typically by criminal entrepreneurs, dramatically raises the prices of illicit drugs without necessarily affecting quantity or the farmer supply curve. (Source: Storti and de Grauwe Citation2009).
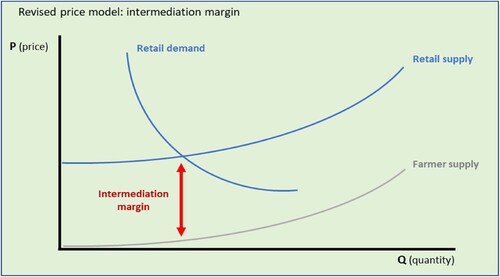
Table 1. Different annual average farmgate prices of opium in Myanmar, 1986–2001 (in $/kg)
Figure 3. Area (hectares) under illicit opium cultivation, Myanmar and Afghanistan, 1985–2021 (Sources: INCSR and WDR, various years).
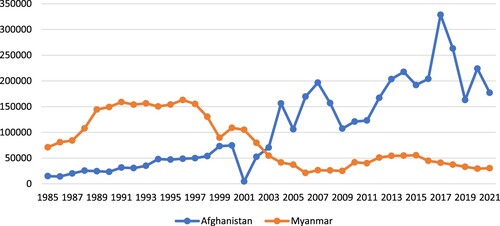
Figure 4. Estimated production of opium (dried) in metric tons, Myanmar and Afghanistan 1983–2021 (Sources: INSCR and WDR).
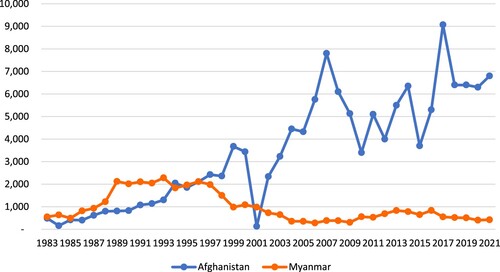
Figure 5. Comparison of farm-gate prices ($/kg) of dried opium in Myanmar as reported in four separate UN documents, 1986–2001.
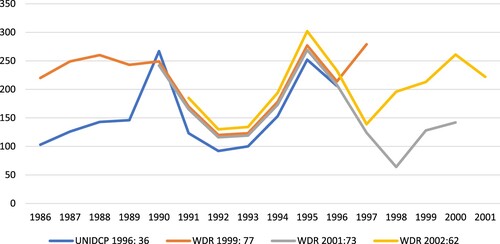
Figure 6. Different coca base prices (US$/kg) in Colombia, 1986–2001.
Note: These are prices of coca base. Coca processing involves turning the leaves into paste, often done in the fields to cut on costs of transport. The paste is then converted into a more concentrated coca base, which may then be brought to makeshift labs near rivers or beside airstrips for further processing into cocaine (DEA, February 1991).
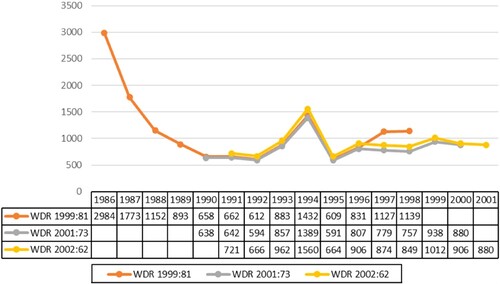
Figure 7. Comparison of coca production in Bolivia, Colombia and Peru, in metric tons, 1986–1998 (source: WDR Citation1999: 42)
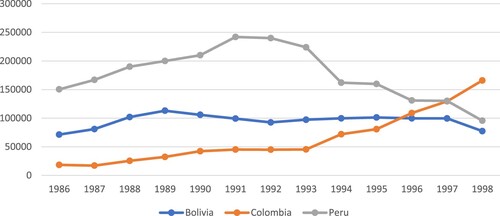
Figure 8. Area under coca cultivation in Colombia (hectares), 1985–2020, as reported separately by annual WDRs and INCSRs
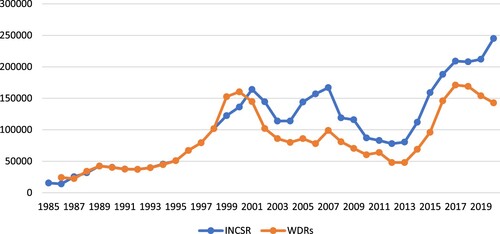
Figure 9. Price tracking of dry opuim prices (US$/kg) in Nangarhar and Kandahar, March 1997 to December 2002 (Source: Afghan Opium Survey 2002 and 2003)
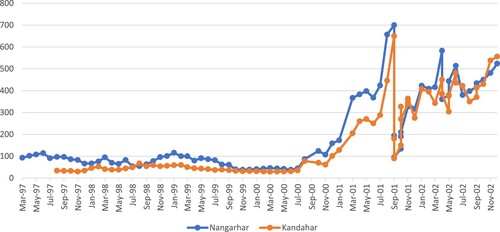
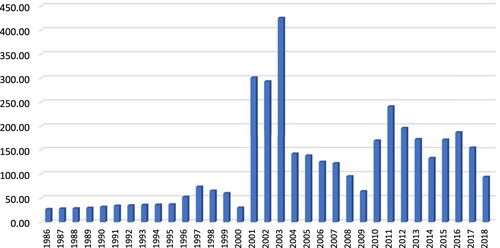
Figure 10. National weighted average annual prices (US$/kg) of dry opium in Afghanistan, 1986–2018 (Source: WDR various years)