Figures & data
Figure 1. Representation of four used probes.
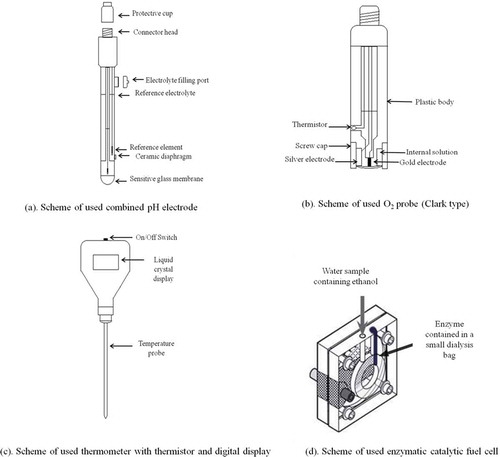
Table 1. Main analytical features of four utilised probes.
Table 2. All experimental values of four measured different parameters in all the analysed natural water samples (each value is the mean of three determinations).
Table 3. Eigenvalues, RSS (residual sum of squares) and PRESS (predictive residual sum of squares), as a function of principal components number.
Figure 2. (a) Scores representation along PC1 and PC2 principal components (triangles = groundwater samples; diamonds = rain samples; circles = river samples); and (b) loadings representation.
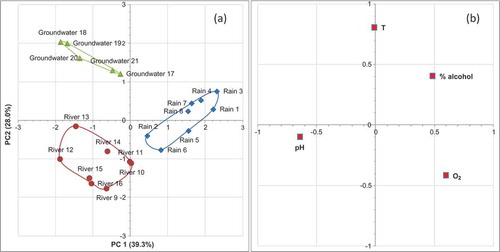
Figure 3. (a) Scores representation along PC1 and PC3 principal components (triangles = groundwater samples; diamonds = rain samples; circles = river samples); and (b) loading representation.
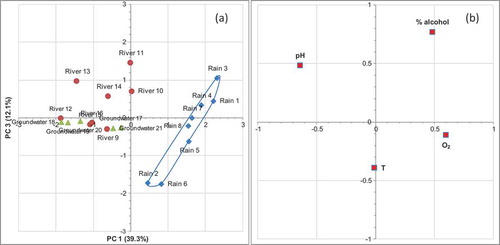
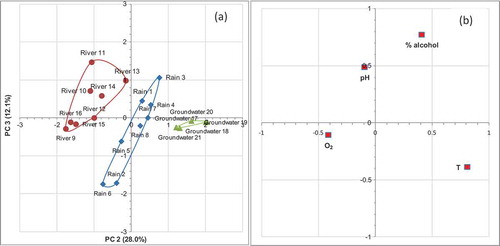
Figure 4. (a) Scores representation along PC2 and PC3 principal components (triangles = groundwater samples; diamonds = rain samples; circles = river samples); and (b) loadings representation.