
Figures & data
Table 1. The time-frame 11–26.06.2013 where all three instruments were operating simultaneously. Isoprene VMR averages and standard deviations from all three instruments PTR-ToF-MS, PTR-QMS and FIS are shown in the table.
Table 2. VOCs observed with the PTR-ToF-MS during the measurement campaign (measured with protonated masses and first number in table refer to m/z).
Table 3. Averages, standard deviations (SD) as well as 90th and 10th percentiles of the mean diurnal (24 h) averages of volume mixing ratios (VMRs) and fluxes measured by PTR-TOF-MS. Data collected during the time-frame 11–26.06.2013. The standard deviations can be found in the table. In addition to the standard deviation, the following instrumental uncertainties of the absolute VMR value are also included: 10% for isoprene, 10% for acetone, 20% for acetaldehyde, 20% for methanol, 20% for MVK/MACR and 10% for monoterpenes.
Table 4. The tropospheric lifetimes have been calculated for a series of VOCs by using their atmospheric reactions with the radicals OH and NO3, with ozone and for their photolysis rate.
Figure 1. Plots of the correlation between the three instruments for the measurement of volume mixing ratios (VMRs) of isoprene: PTR-QMS vs. PTR-ToF-MS (green, y = 1.13×); FIS vs. PTR-ToF-MS (blue, y = 1.22×); FIS vs. PTR-QMS (red, y = 0.92×). The regressions lines were calculated by orthogonal regression using the procedure described in Ref. [Citation41]. The overall uncertainties for isoprene VMR that were measured with the two PTR-MS techniques are taken to be 10%, and the overall uncertainties for isoprene VMR measured with FIS are taken to be 15%.
![Figure 1. Plots of the correlation between the three instruments for the measurement of volume mixing ratios (VMRs) of isoprene: PTR-QMS vs. PTR-ToF-MS (green, y = 1.13×); FIS vs. PTR-ToF-MS (blue, y = 1.22×); FIS vs. PTR-QMS (red, y = 0.92×). The regressions lines were calculated by orthogonal regression using the procedure described in Ref. [Citation41]. The overall uncertainties for isoprene VMR that were measured with the two PTR-MS techniques are taken to be 10%, and the overall uncertainties for isoprene VMR measured with FIS are taken to be 15%.](/cms/asset/64da4e8c-b630-409d-ad62-d89c80ffe8ba/geac_a_1502758_f0001_oc.jpg)
Figure 2. Plots of the correlation between the three instruments for the measurements of fluxes of isoprene: PTR-QMS vs. PTR-ToF-MS (green, y = 1.14x); FIS vs. PTR-ToF-MS (blue, y = 1.22×); FIS vs. PTR-QMS (red, y = 1.03×). The regressions lines were calculated as for Figure 1. See for information about error estimate on the flux data from the three different instruments.
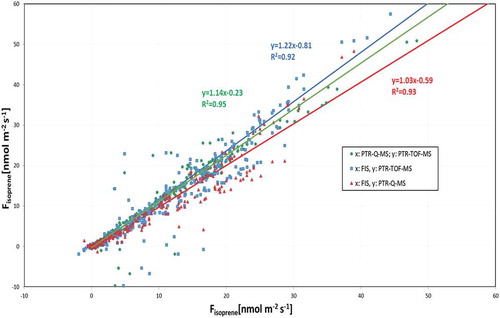
Figure 5. Isoprene fluxes measured with all three instruments during summer 2013. Random error estimates for FIS, PTR-ToF-MS and PTR-QMS flux data are shown as error bars and calculated for all three instruments as described in Section 2.4.5. The authors acknowledge the use of a similar figure in a conference paper/proceeding (see the ‘Acknowledgements’ section for more details).
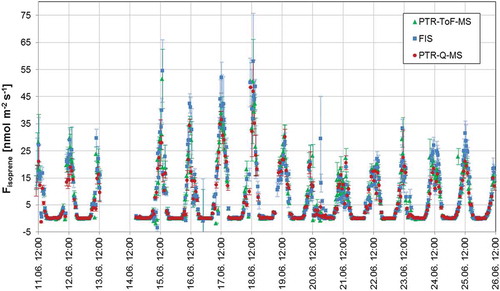
Figure 3. Average diurnal variations of VOCs (PTR-ToF-MS measurements), temperature and short wavelength radiation during the period of the PTR-ToF-MS measurements (11–26.06.2013). Error bars show the standard deviation on the average of the hourly means of the fluxes. ‘Hour of day’ is in UTC.
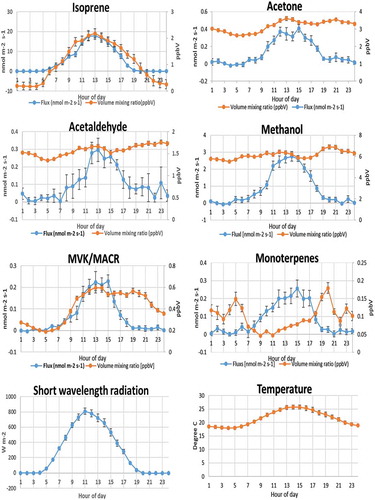
Figure 4. Isoprene volume mixing ratios (VMRs) measured with all three instruments in June 2013. Overall uncertainties for isoprene VMR measured with the two PTR-MS techniques are taken to be 10%. Overall uncertainties for isoprene VMR measured with FIS are taken to be 15%.
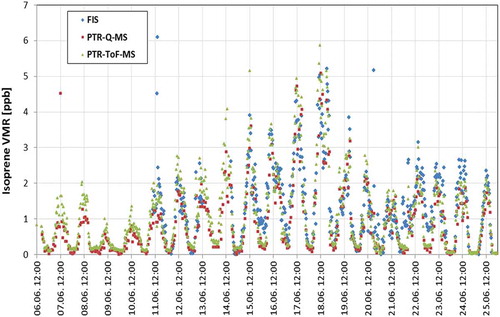
Table 5. Summary of the results obtained in this investigation and the comparison with other studies. Fluxes and VMR values for isoprene, acetone, acetaldehyde, methanol, MVK/MACR and monoterpenes.
Figure A1a. Temperature at the tower top in June 2013 during the measurement campaign.
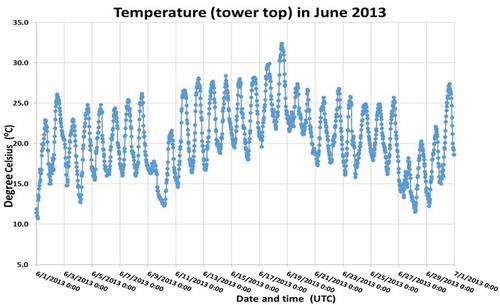
Figure A1b. Relative humidity at the tower top in June 2013 during the measurement campaign.
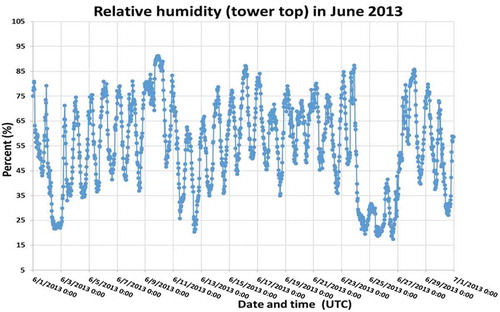
Figure A1c. Wind speed at the tower top in June 2013 during the measurement campaign.
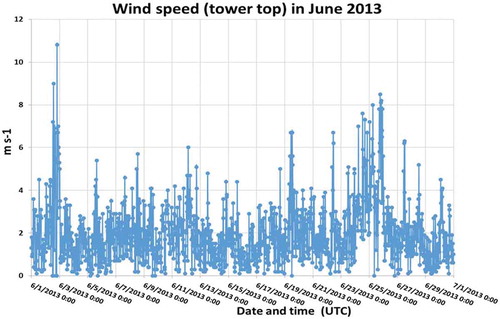
Figure A1d. Solar radiation at the tower top in June 2013 during the measurement campaign.
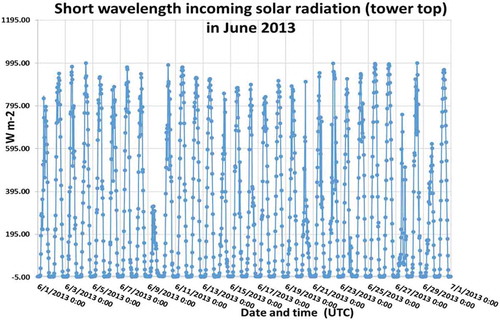
Figure A2. Solar global irradiation, precipitation amount, and temperature monthly means observed at the EMEP/GAW measuring station in the JRC-Ispra in 2013, compared to the 1990–1999 period ± standard deviations (the Figure is from the ref. EUR report [Citation15]).
![Figure A2. Solar global irradiation, precipitation amount, and temperature monthly means observed at the EMEP/GAW measuring station in the JRC-Ispra in 2013, compared to the 1990–1999 period ± standard deviations (the Figure is from the ref. EUR report [Citation15]).](/cms/asset/6830f3bb-176d-42ff-b969-1c42989a9d5a/geac_a_1502758_f0010_oc.jpg)
Table A3. Multi-component calibration mix. (an 11-component VOC standard mixture from Apel-Riemer Environmental Inc., Denver, USA). Uncertainty is a conservative estimate of the combination of the uncertainties of the gravimetric preparation and analysis.
Table A4. Detection limits for the PTR-ToF-MS: Exemplary results from a PTR-ToF-MS calibration performed on 06.06.2013 for all of the VOCs measured in this investigation is shown here. ‘ncps’ is an abbreviation for “normalised counts per second (normalised to 106 cps of (H2O)H+ and (H2O)2H+ ions). Limits of detection (LOD, 2 s) and precision (1 s) values were calculated for a 0.1 s signal integration time.