
Figures & data
Figure 1. (a) Chemical structure of Aflatoxins of B family (B1 and B2) and G family (G1 and G2) [Citation5]. The moiety in blue or red Circle shows the difference between the two groups, and (b) Chemical structure of major functional moieties of Aflatoxins [Citation57].
![Figure 1. (a) Chemical structure of Aflatoxins of B family (B1 and B2) and G family (G1 and G2) [Citation5]. The moiety in blue or red Circle shows the difference between the two groups, and (b) Chemical structure of major functional moieties of Aflatoxins [Citation57].](/cms/asset/c9d6631c-cd42-4e2f-b544-54f326a79d9b/geac_a_1819993_f0001_oc.jpg)
Table 1. Analytical and performance characteristics of the aflatoxins determination method.
Figure 2. UHPLC-FLD chromatogram of sample A (4.27 x 10⁻¹μg/kg aflatoxin G1 (AFLA.G1)).
Figure 3. Pictures of microorganisms isolated from the studied samples of coffee. (a) colonies of Aspergillus niger, (b) Mucor sp. Fusarium and yeast sp. 2., (c) Fusarium and yeast sp. 1 colonies, (d) Colonies of Aspergillus niger group and Fusarium sp.
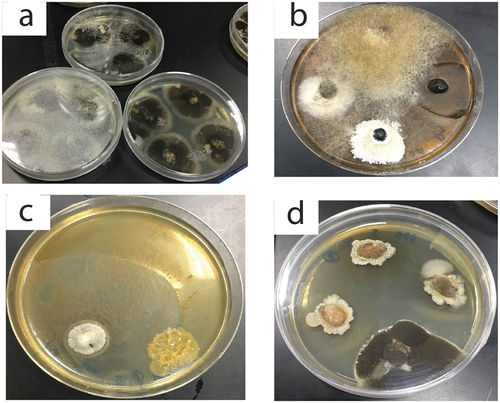
Table 2. List of microorganisms (Bacteria and Fungi) isolated from different coffee samples collected from the local Doha market.