
Figures & data
Figure 1. Occupational wellbeing profiles (OWP) observed among teachersA, guidance counsellorsB, and in occupational heterogeneous samples (no superscript). Solid outlines refer to OWPs which are in line with the circumplex model of occupational wellbeing (Bakker & Oerlemans, Citation2011) whereas dashed outlines refer to OWPs that suggest alternative or additional types of OWPs in relation to this model.
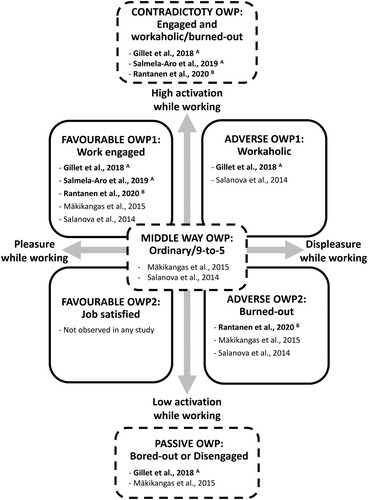
Table 1. Means and standard deviations for occupational wellbeing indicators and mean-level comparisons between samples and time points.
Figure 2. Occupational wellbeing profiles among guidance counsellors in 2019 (n = 211), in 2020 (n = 343) and in 2021 (n = 176). Counts above each bar are observed mean scores except dispersion LPA model means. The latter are estimated sample means from multi-group latent profile analysis model in which the profile indicator means are constrained equal across the time points, that is, the yearly samples ( = multi-groups) within each profile. Percentages below each diagram refer to the proportion of the whole sample in a given year, that is, prevalence rates of each profile within each year.
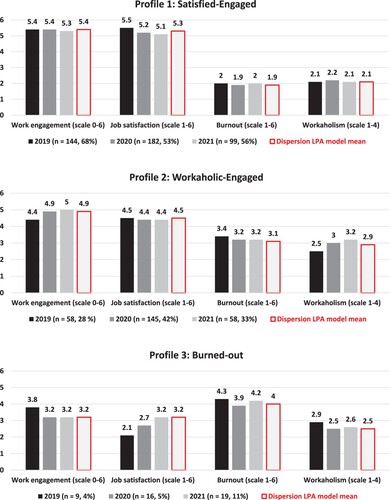
Table 2. Fit indices and statistical tests for the estimated Latent Profile Analysis profile solutions and models.
Data availability statement
The authors have full control over the data reported in this text and agree to make the materials and data available to the journal and other researchers provided that their requests do not violate the European Data Protection Regulation statutes.