Figures & data
Figure 1. Hypothesised path relationships between quality culture variables.
Note: the line connecting the ‘leadership’ and ‘organisational values’ variables reflects that a relation between these variables is expected, but that the direction of causality is unknown.
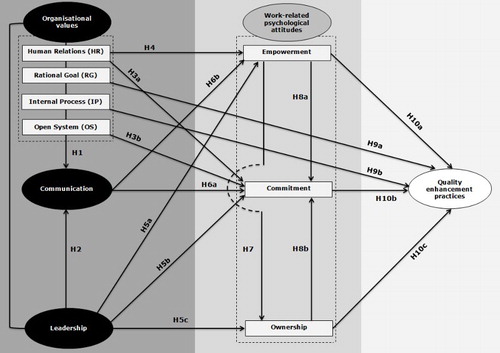
Table 1. Descriptive statistics, correlations and Alpha Reliability Estimates (on the diagonal) of quality culture variables.
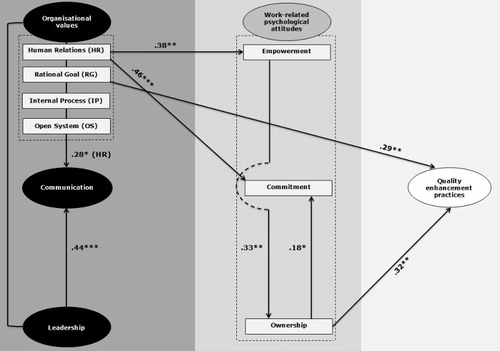
Figure 2. Path model standardised coefficients of the relations between quality culture variables; *p < .05; **p < .01, *** p < .001.
Note: the relationships between variables depicted in resemble the hypothesised relationships as presented in which were found to be statistically significant; the line connecting the ‘leadership’ and ‘organisational values’ variables reflects that a relation between these variables is expected, but that the direction of causality is unknown.