
Figures & data
Figure 1. Adopter categorization based on innovativeness (Rogers Citation1983).
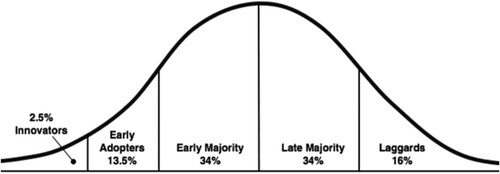
Table 1. Network measures used in the study and the purpose of their use.
Figure 2. Distribution of the results in the DOI survey and the subsequent categorization.
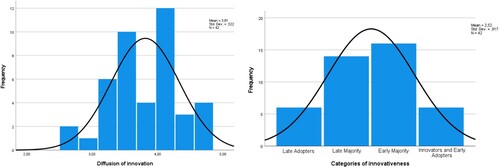
Figure 3. Network visualization of the overlap between algorithm-detected subgroups departmental research groups. The four research groups are labeled as A, B, C, D, and the four detected communities are also labeled as A, B, C, D. In cases where there is an overlap between the two, the nodes are gray, and in the four cases where there is no overlap, the nodes are red.
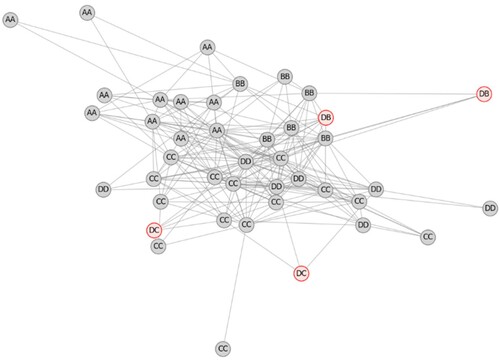
Figure 4. Comparison of the complete teaching network (338 ties) with the teaching network consisting of strong ties (62 ties).
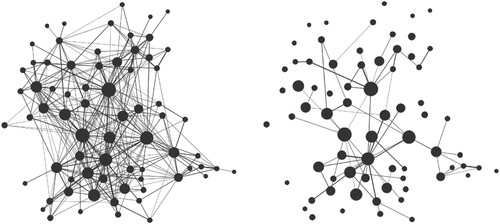
Figure 5. Comparison of the influence on the network (i.e. eigenvector centrality) of different categories of innovativeness for both the full network and frequent conversations (i.e. strong ties).
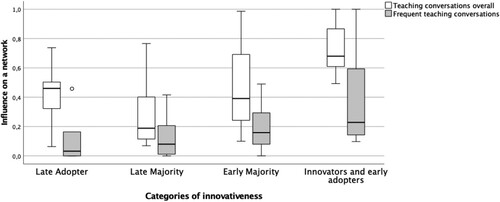
Figure 6. Combined personal networks of most innovative teachers. Black nodes indicate Innovators and Early adopters, gray nodes indicate other teachers.
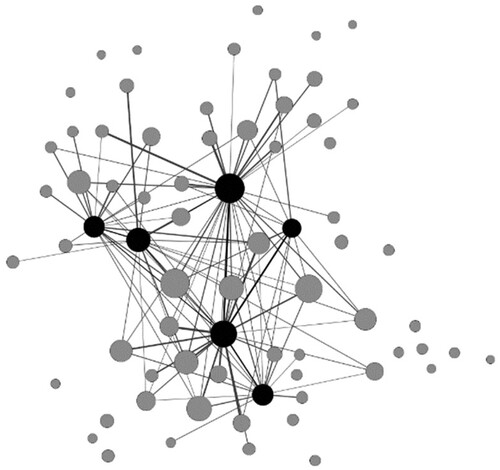
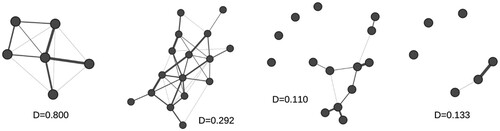
Figure 7. Graph densities of Innovators and Early adopters (1st), Early majority (2nd), Late majority (3rd), Late adopters (4th).
Data availability statement
The datasets analyzed during the current study are not publicly available as part of data protection legislation, but the modified version based on anonymized and deidentified data is available from the corresponding author on reasonable request.