
Figures & data
Table 1. Demographic characteristics of participants.
Table 2. Coping strategy use, mean coping scores and mean psychosocial distress levels.
Figure 1. Coping profiles identified through latent profile analysis of the total sample (n = 376).
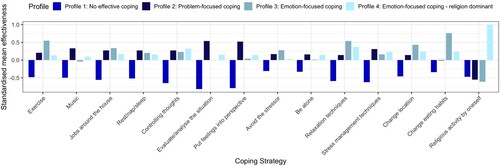
Table 3. Demographic characteristics of coping profiles and p-values from demographic profile comparison analyses
Figure 2. Mean psychosocial distress levels compared between the four coping profiles.
Note: NEC = No effective/no coping, PFC = Problem-focused coping, EFC = Emotion-focused coping, EFC-R = Emotion-focused religion-dominant coping. * p < .05, ** p < .01 and *** p < .001.
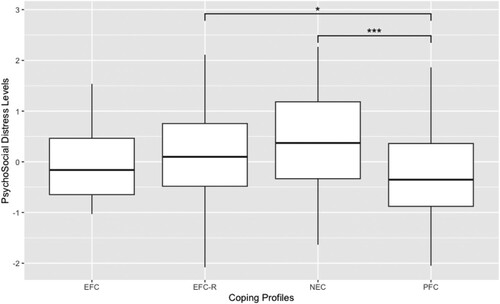
Table 4. Post-hoc comparisons of psychosocial distress levels between coping profiles.