Figures & data
Table 1. Number of culture positive animals, mortality and lesions at different times post i.v. inoculation of G. anatis in chickens
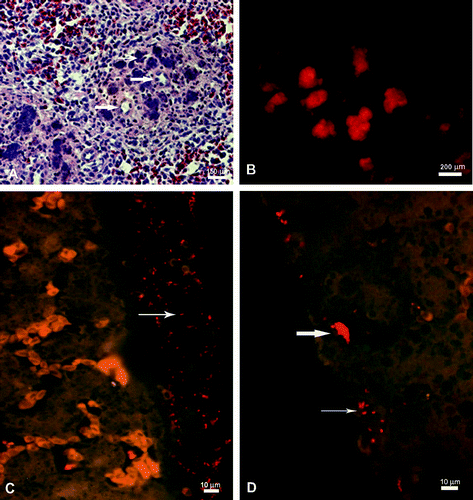
Figure 1. 1A: The spleen from an intravenously inoculated and heterophil-depleted chicken, 12 h p.i. The splenic penicilium arteriole (thick arrow) surrounded by ellipsoids filled with degranulated heterophils, eosinophilic aggregates and proteinaceus fluid (thin arrow) (HE stain). 1B: The spleen section (as 1A) demonstrating a signal distribution corresponding to the eosinophilic aggregates observed in 1A showing microcolonies of Gallibacterium (FISH). 1C: The liver from an i.p. inoculated and heterophil-depleted chicken, 12 h p.i. Blood-filled sinousoids and a thick perihepatic layer of pus (arrow) including Gallibacterium and erythrocytes (FISH). 1D: The liver from an i.p. inoculated and heterophil-depleted chicken, 12 h p.i. Single cells (thin arrow) and microcolonies (thick arrow) of Gallibacterium visualized intracapsularly and subcapsularly (FISH).