1,957
Views
84
CrossRef citations to date
0
Altmetric
Original Articles

A molecular epidemiological investigation of isolates of the variant avian paramyxovirus type 1 virus (PPMV-1) responsible for the 1978 to present panzootic in pigeons

Pages 258-269 | Received 01 Jan 2003, Accepted 01 Sep 2003, Published online: 19 Oct 2010

Figures & data

Table 1. Details of ND (APMV-1) viruses analysed in this study

Figure 1. Unrooted maximum likelihood radial phylogram based on nucleotide sequence data from 225 APMV-1 isolates, including 208 PPMV-1 isolates and 17 representative of the other genetic lineages (Aldous et al., Citation2003). The region analysed was a 375 base pair fragment (47 to 422) at the 3′ end of the fusion protein gene. Branch lengths represent the predicted number of substitutions and are proportional to the differences between the isolates. The individual names of each PPMV-1 isolate included in this phylogram are not included. The groups selected for this study are shaded on the tree and labelled. The branch to isolate HFRDK77188 (group 6) is not drawn to scale; its actual branch length value is 1.66.
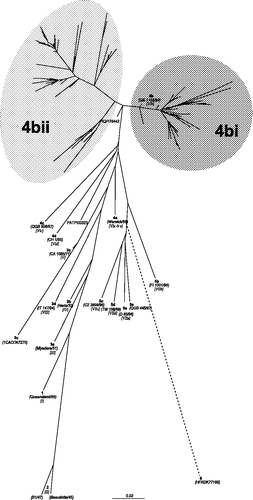
Figure 1. Unrooted maximum likelihood radial phylogram based on nucleotide sequence data from 225 APMV-1 isolates, including 208 PPMV-1 isolates and 17 representative of the other genetic lineages (Aldous et al., Citation2003). The region analysed was a 375 base pair fragment (47 to 422) at the 3′ end of the fusion protein gene. Branch lengths represent the predicted number of substitutions and are proportional to the differences between the isolates. The individual names of each PPMV-1 isolate included in this phylogram are not included. The groups selected for this study are shaded on the tree and labelled. The branch to isolate HFRDK77188 (group 6) is not drawn to scale; its actual branch length value is 1.66.

Figure 2. Unrooted maximum likelihood radial phylogram of subgroup 4bi isolates, based on nucleotide sequence data from 91 PPMV-1 isolates. The region analysed was a 375 base pair fragment (47 to 422) at the 3′ end of the fusion protein gene. Branch lengths represent the predicted number of substitutions and are proportional to the differences between the isolates. * Isolates represent at least one other identical sequence as presented in .
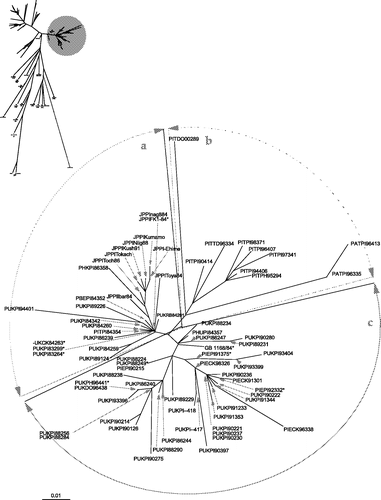
Figure 2. Unrooted maximum likelihood radial phylogram of subgroup 4bi isolates, based on nucleotide sequence data from 91 PPMV-1 isolates. The region analysed was a 375 base pair fragment (47 to 422) at the 3′ end of the fusion protein gene. Branch lengths represent the predicted number of substitutions and are proportional to the differences between the isolates. * Isolates represent at least one other identical sequence as presented in Table 2.

Figure 3. Unrooted maximum likelihood radial phylogram of subgroup 4bii isolates, based on nucleotide sequence data from 114 PPMV-1 isolates. The region analysed was a 375 base pair fragment (47 to 422) at the 3′ end of the fusion protein gene. Branch lengths represent the predicted number of substitutions and are proportional to the differences between the isolates. * Isolates represent at least one other identical sequence as presented in .
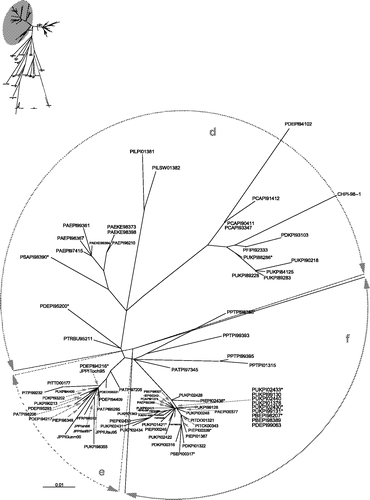
Figure 3. Unrooted maximum likelihood radial phylogram of subgroup 4bii isolates, based on nucleotide sequence data from 114 PPMV-1 isolates. The region analysed was a 375 base pair fragment (47 to 422) at the 3′ end of the fusion protein gene. Branch lengths represent the predicted number of substitutions and are proportional to the differences between the isolates. * Isolates represent at least one other identical sequence as presented in Table 2.

Table 2. Isolates included in and (marked *) that represent other isolates with identical sequences

Figure 4. Percentage distribution of isolates in group 4bi and group 4bii according to year of isolation (data label is actual number of isolations).
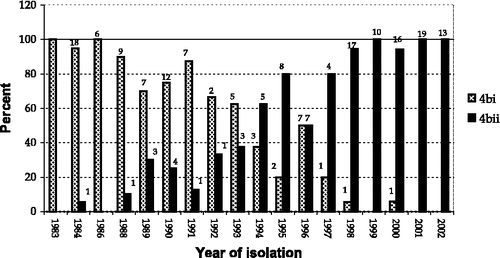
Figure 4. Percentage distribution of isolates in group 4bi and group 4bii according to year of isolation (data label is actual number of isolations).

Reprints and Corporate Permissions

Please note: Selecting permissions does not provide access to the full text of the article, please see our help page How do I view content?

To request a reprint or corporate permissions for this article, please click on the relevant link below:

Academic Permissions

Please note: Selecting permissions does not provide access to the full text of the article, please see our help page How do I view content?

Obtain permissions instantly via Rightslink by clicking on the button below:

If you are unable to obtain permissions via Rightslink, please complete and submit this Permissions form. For more information, please visit our Permissions help page.