1,020
Views
13
CrossRef citations to date
0
Altmetric
Original Articles

Circovirus-infected geese studied by in situ hybridization

, , , &
Pages 227-232 | Received 04 Jan 2005, Accepted 09 Mar 2005, Published online: 19 Oct 2010

Figures & data

Table 1. Results of examination of tissues from diseased geese for circovirus by in situ hybridization: where available, results of negative contrast electron microscopic examination are given in parentheses

Figure 1. 1a: Low magnification picture of the BF showing circovirus DNA (labelled brown). Some follicles are heavily infected while others are uninfected. Infected cells are present in both the cortex and medulla of follicles. Bar=100 μm. 1b: H&E-stained section of BF adjacent to the section in 1a. The heavily infected follicle is less densely populated by lymphocytes, thus appearing less intensely stained. Bar=100 μm. 1c: High magnification of a heavily infected follicle showing large degenerate cells (arrows). Bar=12 μm.
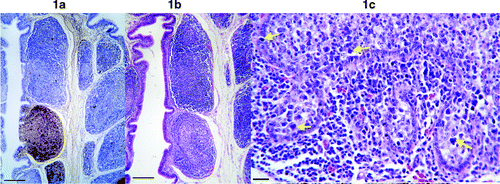
Figure 1. 1a: Low magnification picture of the BF showing circovirus DNA (labelled brown). Some follicles are heavily infected while others are uninfected. Infected cells are present in both the cortex and medulla of follicles. Bar=100 μm. 1b: H&E-stained section of BF adjacent to the section in 1a. The heavily infected follicle is less densely populated by lymphocytes, thus appearing less intensely stained. Bar=100 μm. 1c: High magnification of a heavily infected follicle showing large degenerate cells (arrows). Bar=12 μm.

Figure 2. 2a: Low magnification of an infected thymus showing virus positive cells in both the cortex and medulla. Bar=100 μm. 2b: High magnification of the thymus showing nuclear labelling of lymphocytes (arrows), dense labelling in very enlarged cells (white arrowhead) and in an unidentified structure (see results) (black arrowhead). Bar=10 μm.

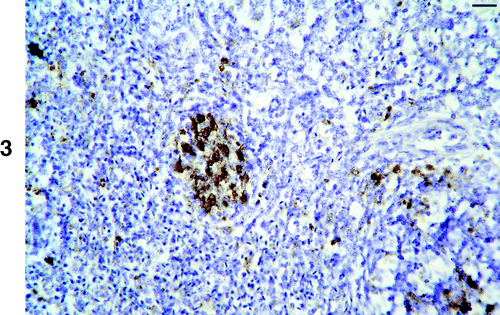
Figure 2. 2a: Low magnification of an infected thymus showing virus positive cells in both the cortex and medulla. Bar=100 μm. 2b: High magnification of the thymus showing nuclear labelling of lymphocytes (arrows), dense labelling in very enlarged cells (white arrowhead) and in an unidentified structure (see results) (black arrowhead). Bar=10 μm.
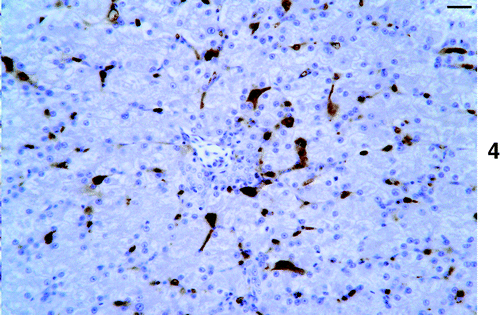
Figure 3. Section of spleen showing abundant virus DNA labelling in a germinal centre. Bar=10 μm.

Figure 3. Section of spleen showing abundant virus DNA labelling in a germinal centre. Bar=10 μm.

Figure 4. ISH on liver showing abundant virus DNA, which is mainly present in sinusoidal lining cells. Bar=10 μm.

Figure 4. ISH on liver showing abundant virus DNA, which is mainly present in sinusoidal lining cells. Bar=10 μm.

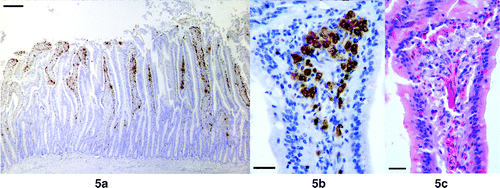
Figure 5. 5a: Small intestine showing large quantities of DNA in the lamina propria of the villi. 5b: Higher magnification showing infected cells in a mainly subepithelial location. Bar=10 μm. 5c: Adjacent H&E section showing that the infected cells resemble macrophages. Bar=10 μm.

Figure 5. 5a: Small intestine showing large quantities of DNA in the lamina propria of the villi. 5b: Higher magnification showing infected cells in a mainly subepithelial location. Bar=10 μm. 5c: Adjacent H&E section showing that the infected cells resemble macrophages. Bar=10 μm.

Reprints and Corporate Permissions

Please note: Selecting permissions does not provide access to the full text of the article, please see our help page How do I view content?

To request a reprint or corporate permissions for this article, please click on the relevant link below:

Academic Permissions

Please note: Selecting permissions does not provide access to the full text of the article, please see our help page How do I view content?

Obtain permissions instantly via Rightslink by clicking on the button below:

If you are unable to obtain permissions via Rightslink, please complete and submit this Permissions form. For more information, please visit our Permissions help page.